
Overview
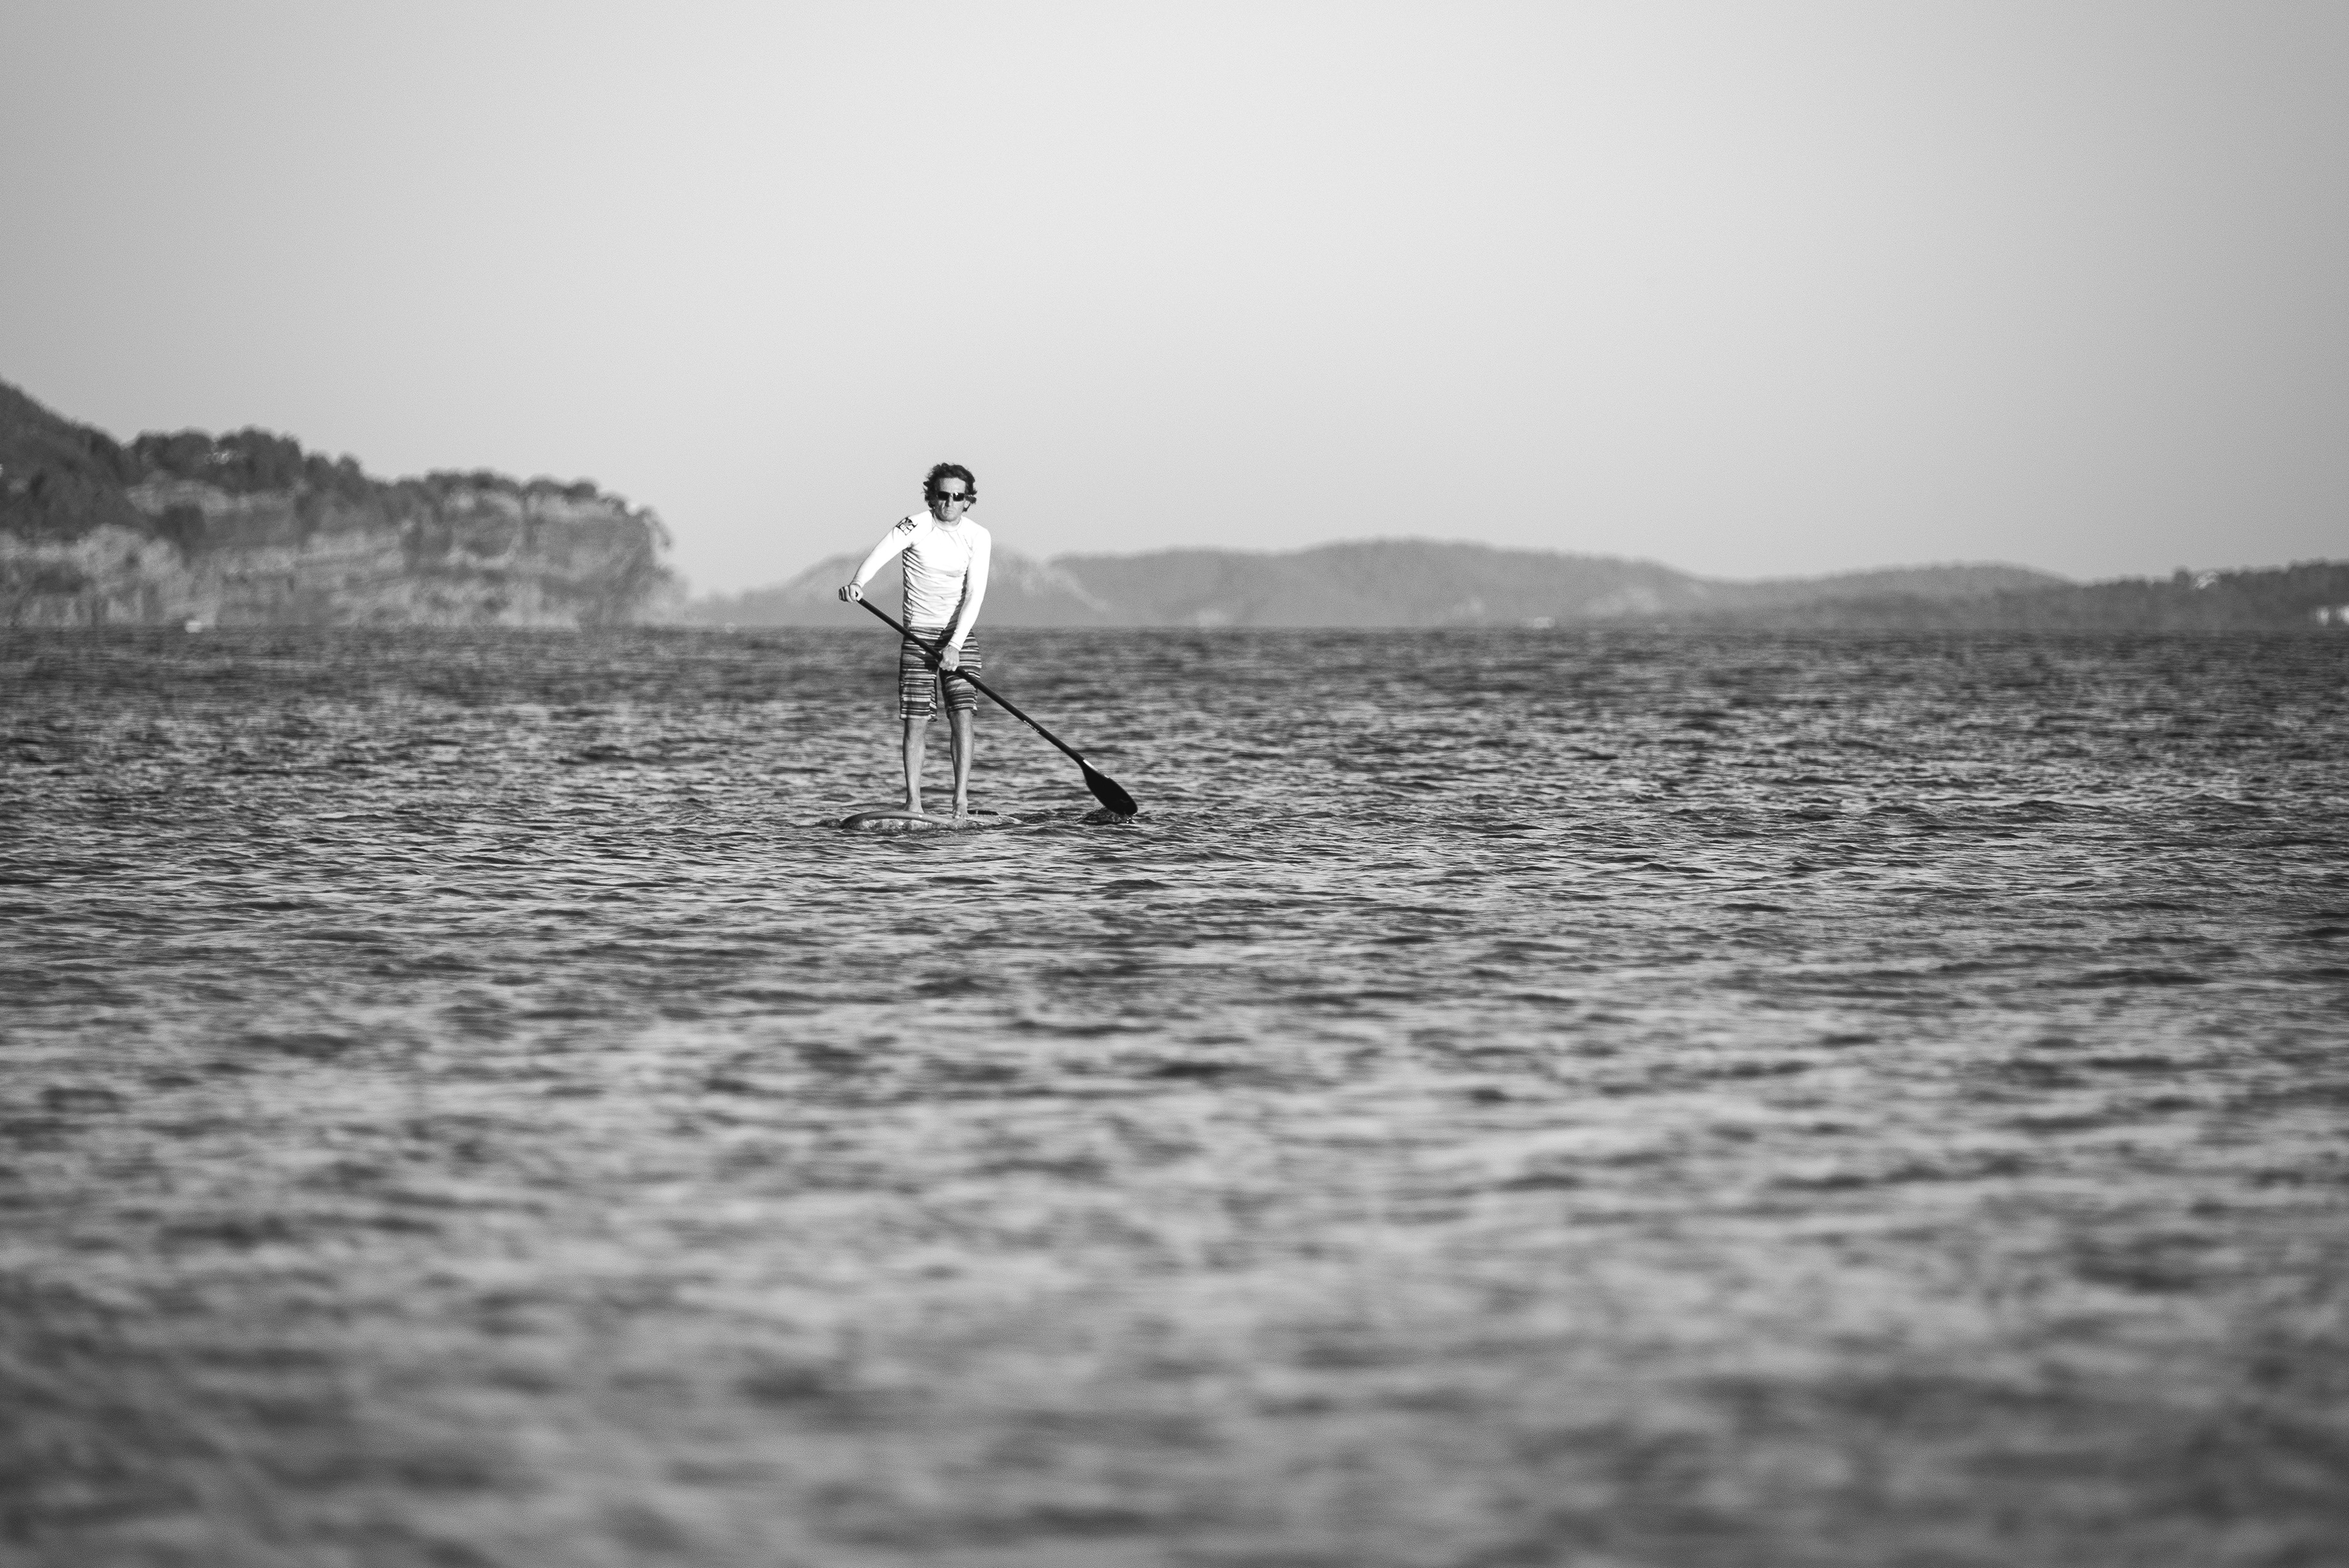
On summer 2023 at Malaga, Spain, two young men jumped into the water with one Paddle board at sunrise when the wind suddenly changed from off shore at high speeds, preventing them to come back to shore.
As a result of this unfortunate event I Hypothesised that there are a hole bunch of users out there that could be exposed to similar fate. There is where I wondered, could there be an app for preventing unfortunate events? or for providing awareness to people? Maybe being alerted?
All of these questions allowed me to think how this App should be and which impact this could have.
Understanding the Problem
For this project I focused mainly into Paddleboad users. That being said, of course the app can be used for different kinds of users with related activities. There reason for this niche is because I observed in the last years a big rise up on the people practicing this sport and specially because it does not require great amount of skills, the range of people with and without experience on the water is extensive. As myself growing by the sea this scenario concerns me.
Problem Statement:
Potential users, need a way to be aware about weather conditions and environments in a clear and simple way. Because not taking the right precautions can turn into unfortunate events
Competitors Analysys
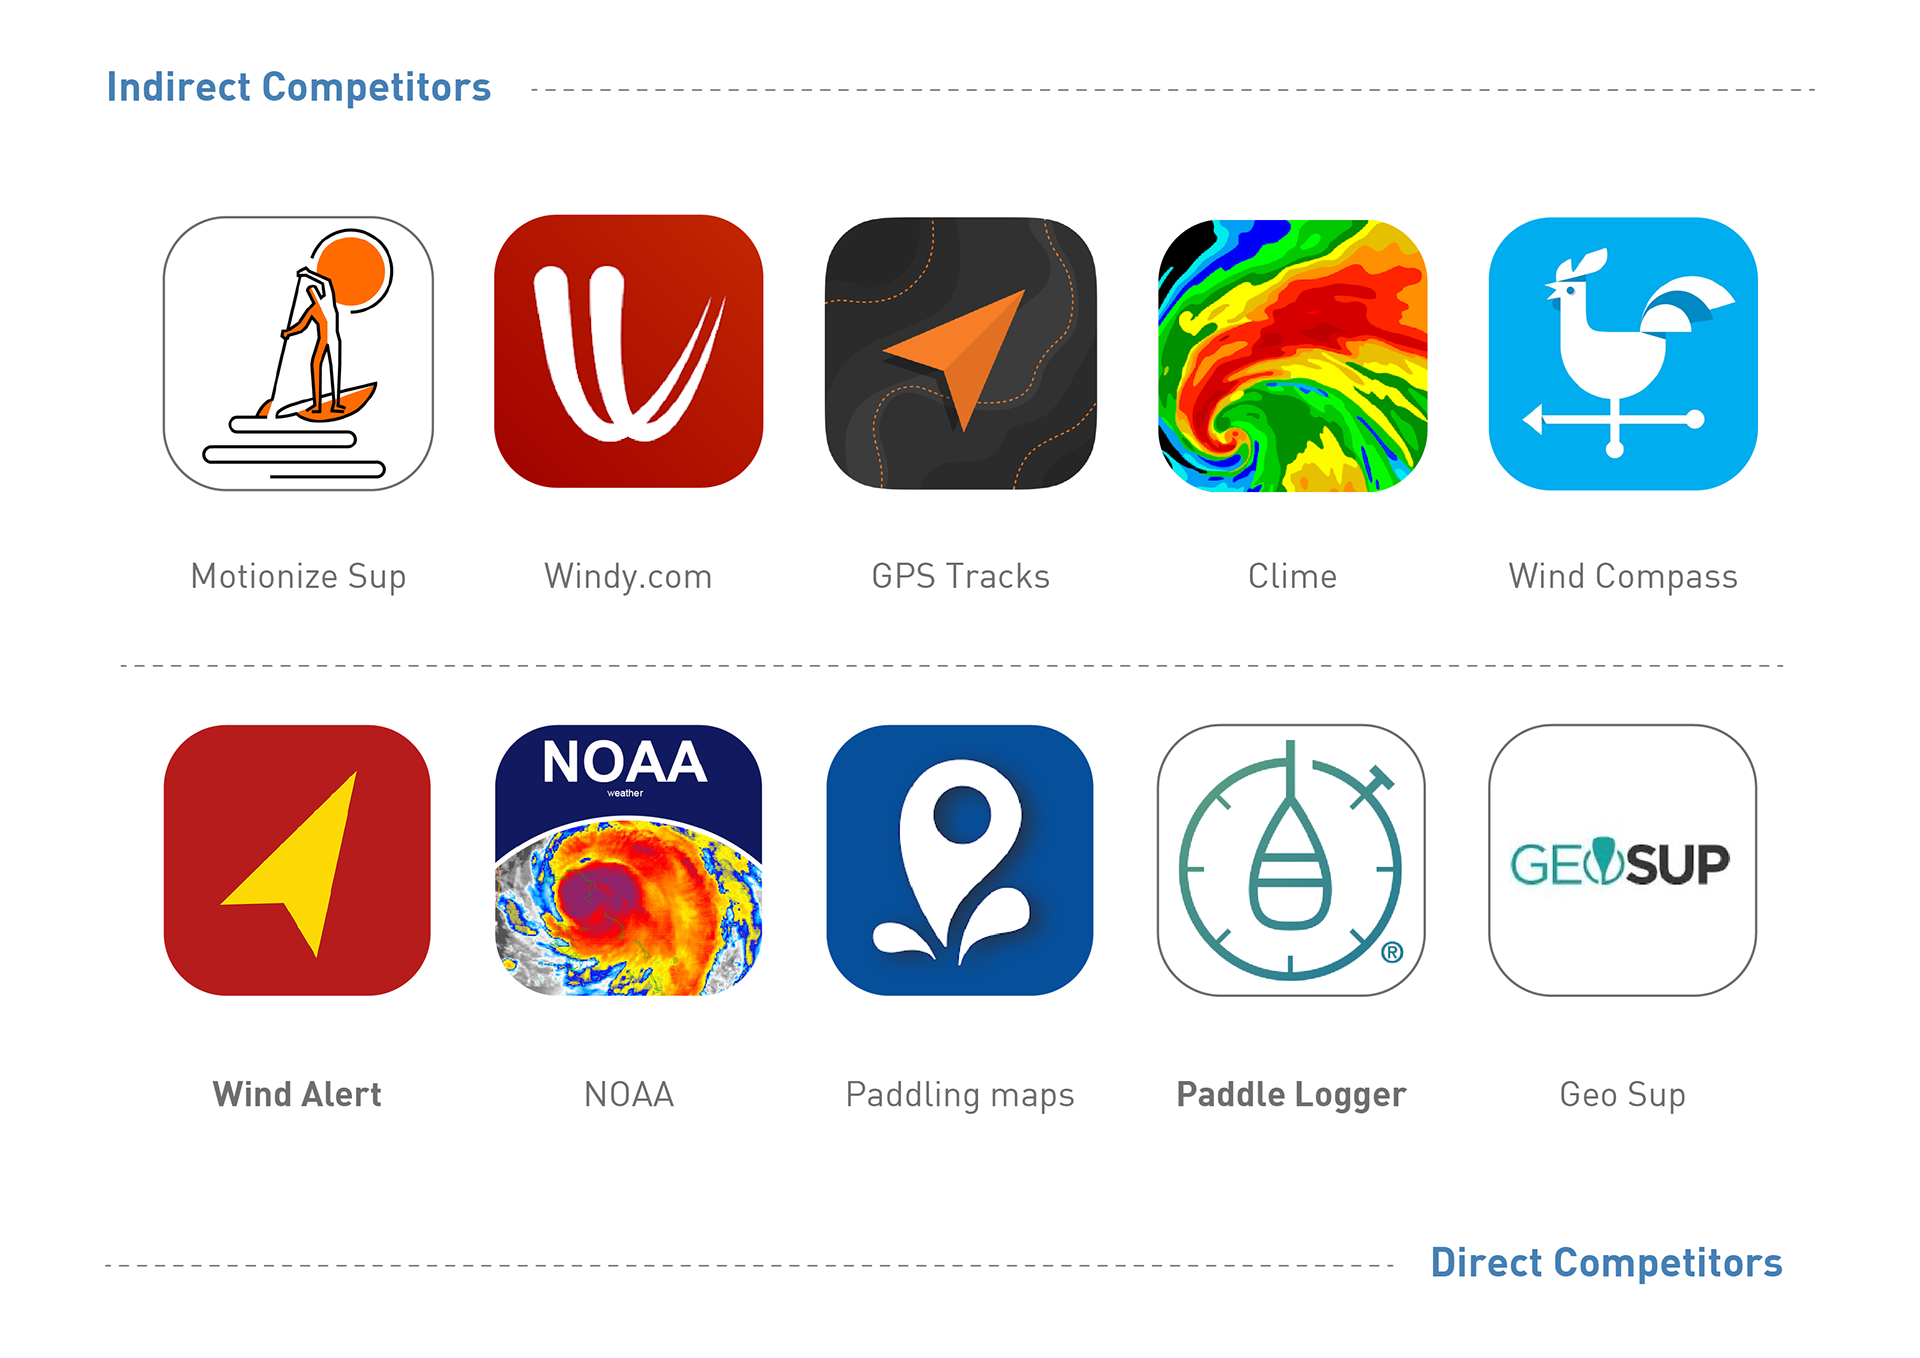
At this stage the Top 10 direct and indirect competitors for Paddleboarding Apps were analysed.
I decided to create two categories:
- Indirect Competitors, related to Weather Radar Apps, and weather alerts.
- Direct competitors, which are GPS trackers/Digital Guides which provide information of specific areas and activities.
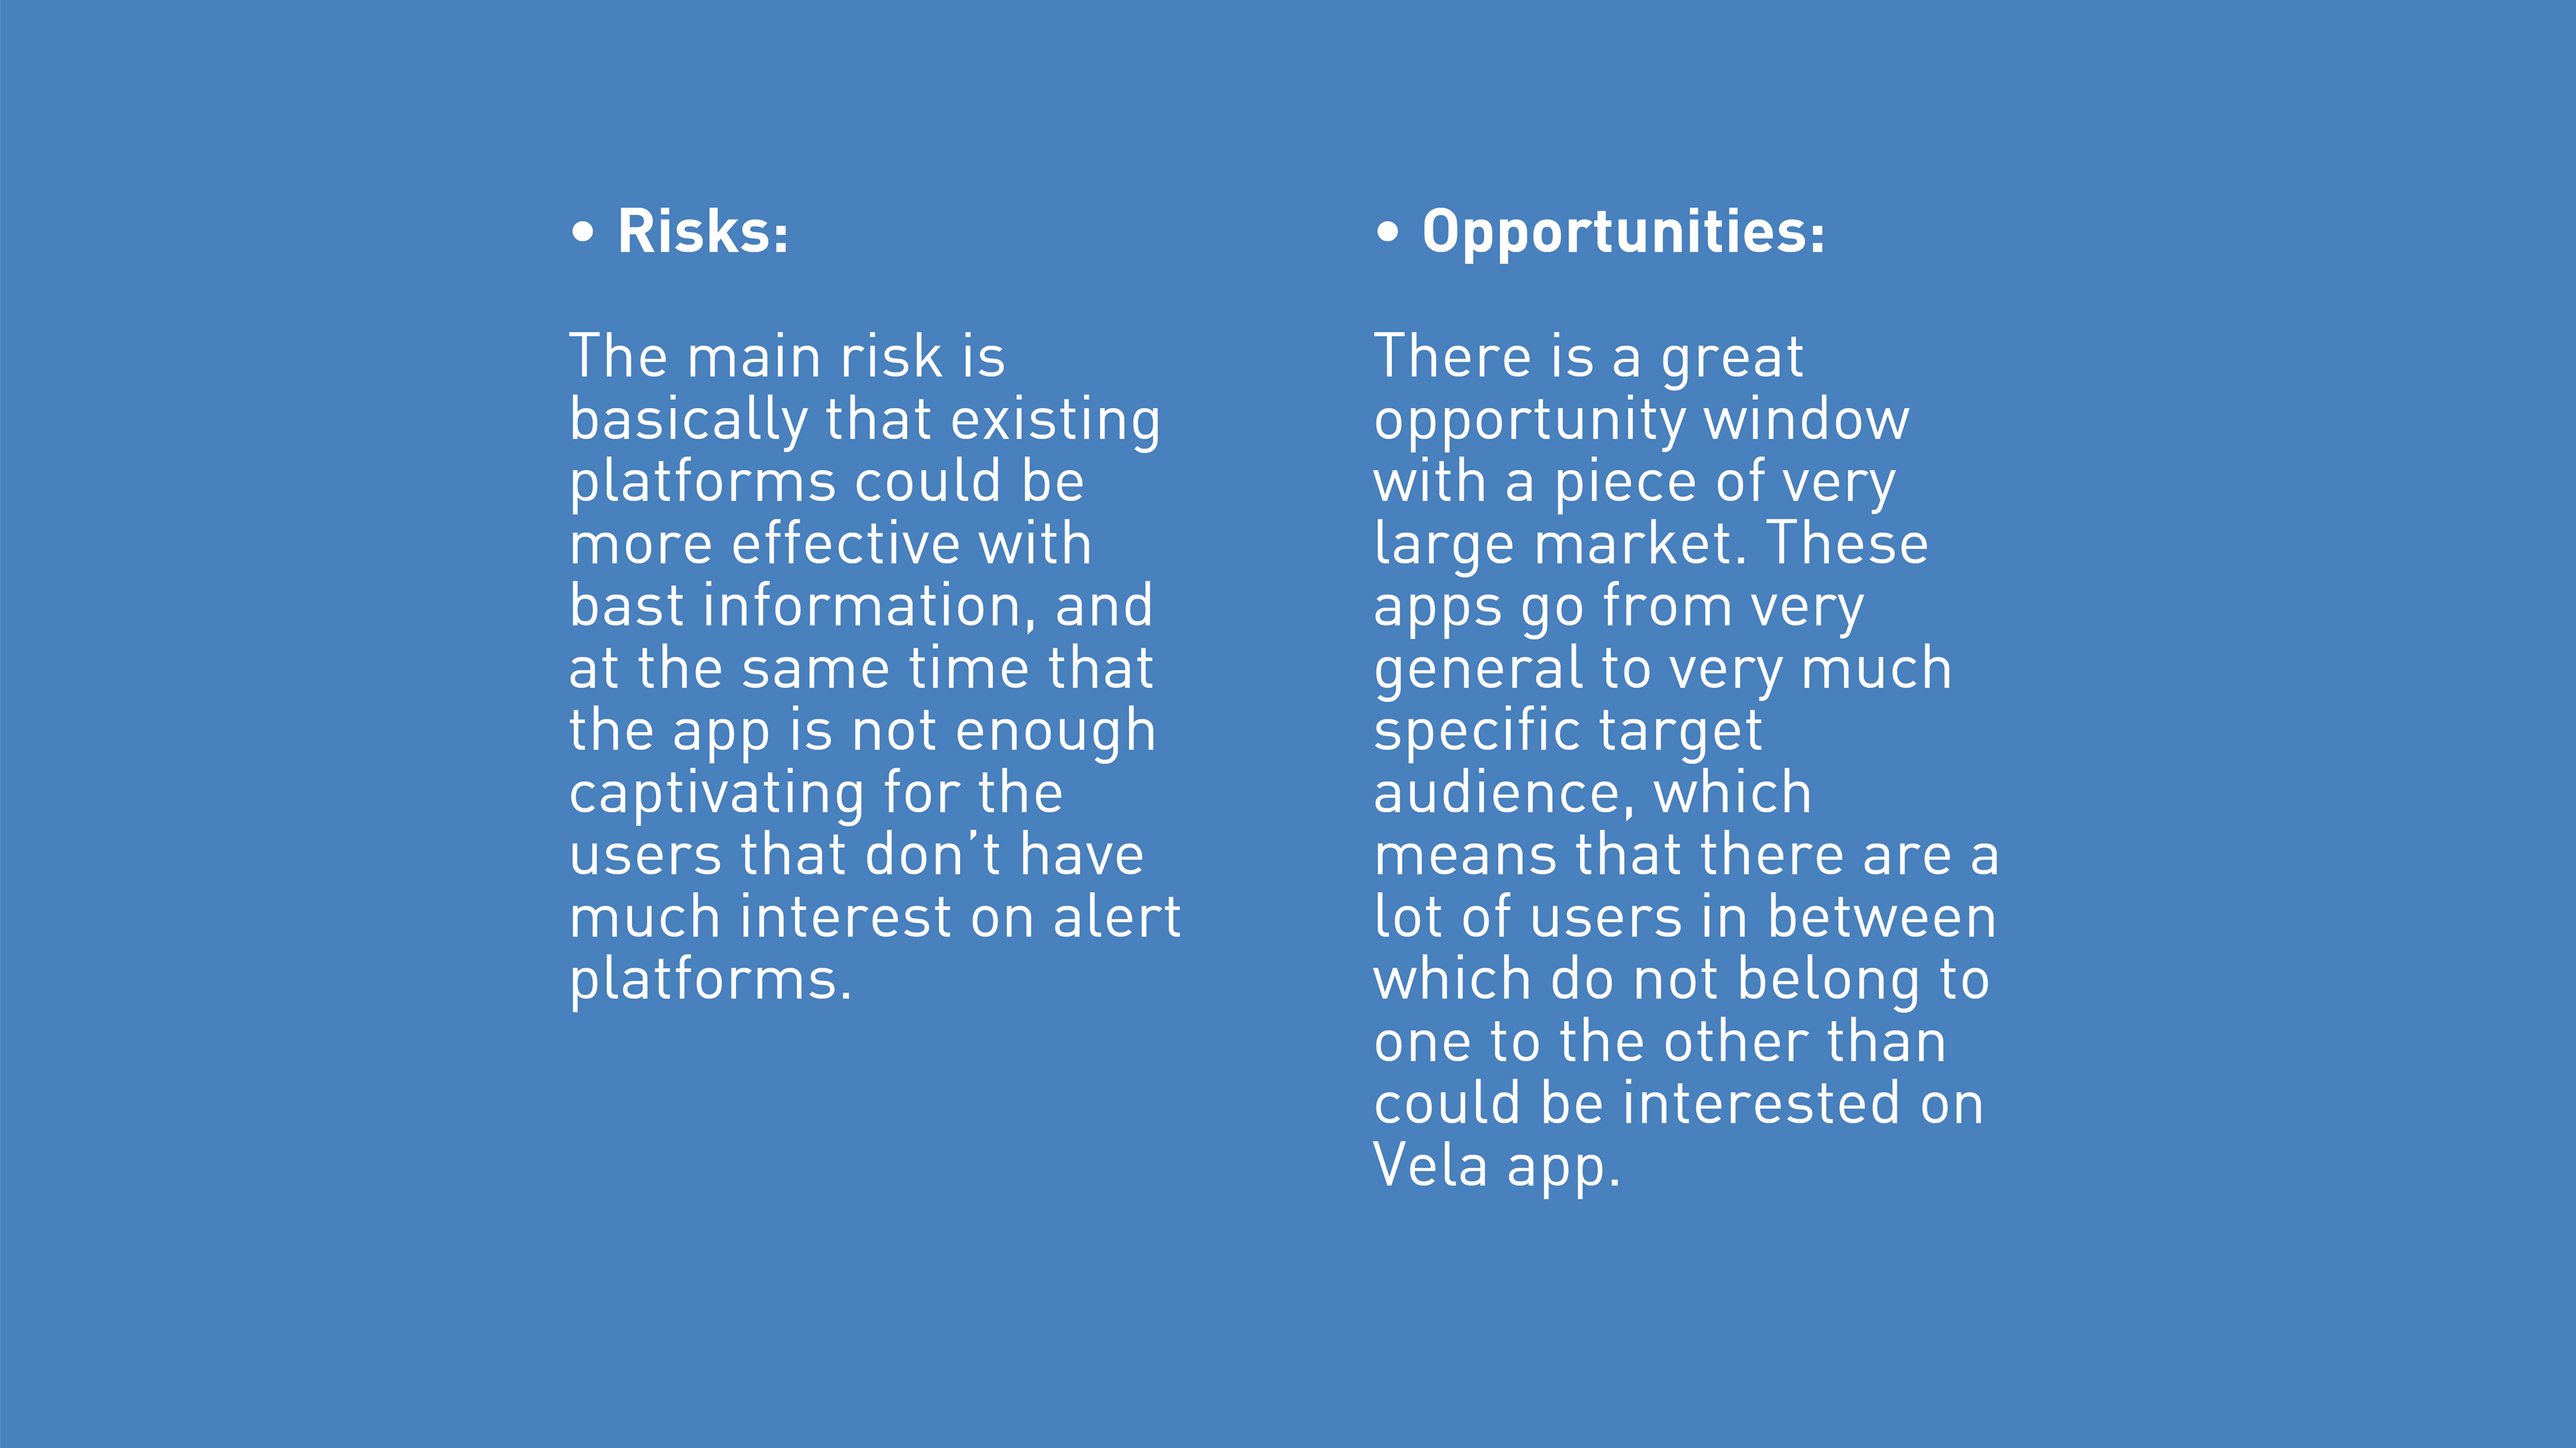
Swot Analysis:
The best way to understand the main competitors was through SWOT. In this way I could find how out-stand with Vela.

Business Requirements
After analysing the competitors strategies I created I Business Requirements Document in order to align users needs with business goals, in this way to make sure that Velas strategy is feasible.
Target audience
The Aim user will be from beginners to mid experienced. Since is an easy sport to jump in without having great skills or previously learnt techniques, this could mean that the range of age will variate significantly.
User Stories
"As a registered user. I want to be able to flow properly through the menu, so I don’t get overwhelmed by to much information."
"When I am leaving a to a place without Internet connection, I would like to be able to download maps and guides, so I am able to use them offline."
User Interviews
For this stage of research the focus was on users close to the coast who are familiarised with paddle boarding. As I have contact with people near coastal cities, I got in touch and scheduled the interviews for gathering information.
The result was somehow surprising and enriching at the same time.
Research Goals:
A. Find out how much the user identifies with the Problem Statement
B. Learn about the User in order to find out if we missed some critical information or to add new functions for the product.
Findings:
- Occasionally Riders
- There is few weather forecast consideration
- Users do not apply safety measurements
- Users pay attention to the environment and the sea, mainly intuitively
Insights:
- Calm waters bring enjoyment
- Warm weather is enough for occasional rides
- Weather conditions underestimation
- Being aware of climate conditions encourage users to practice more the sport
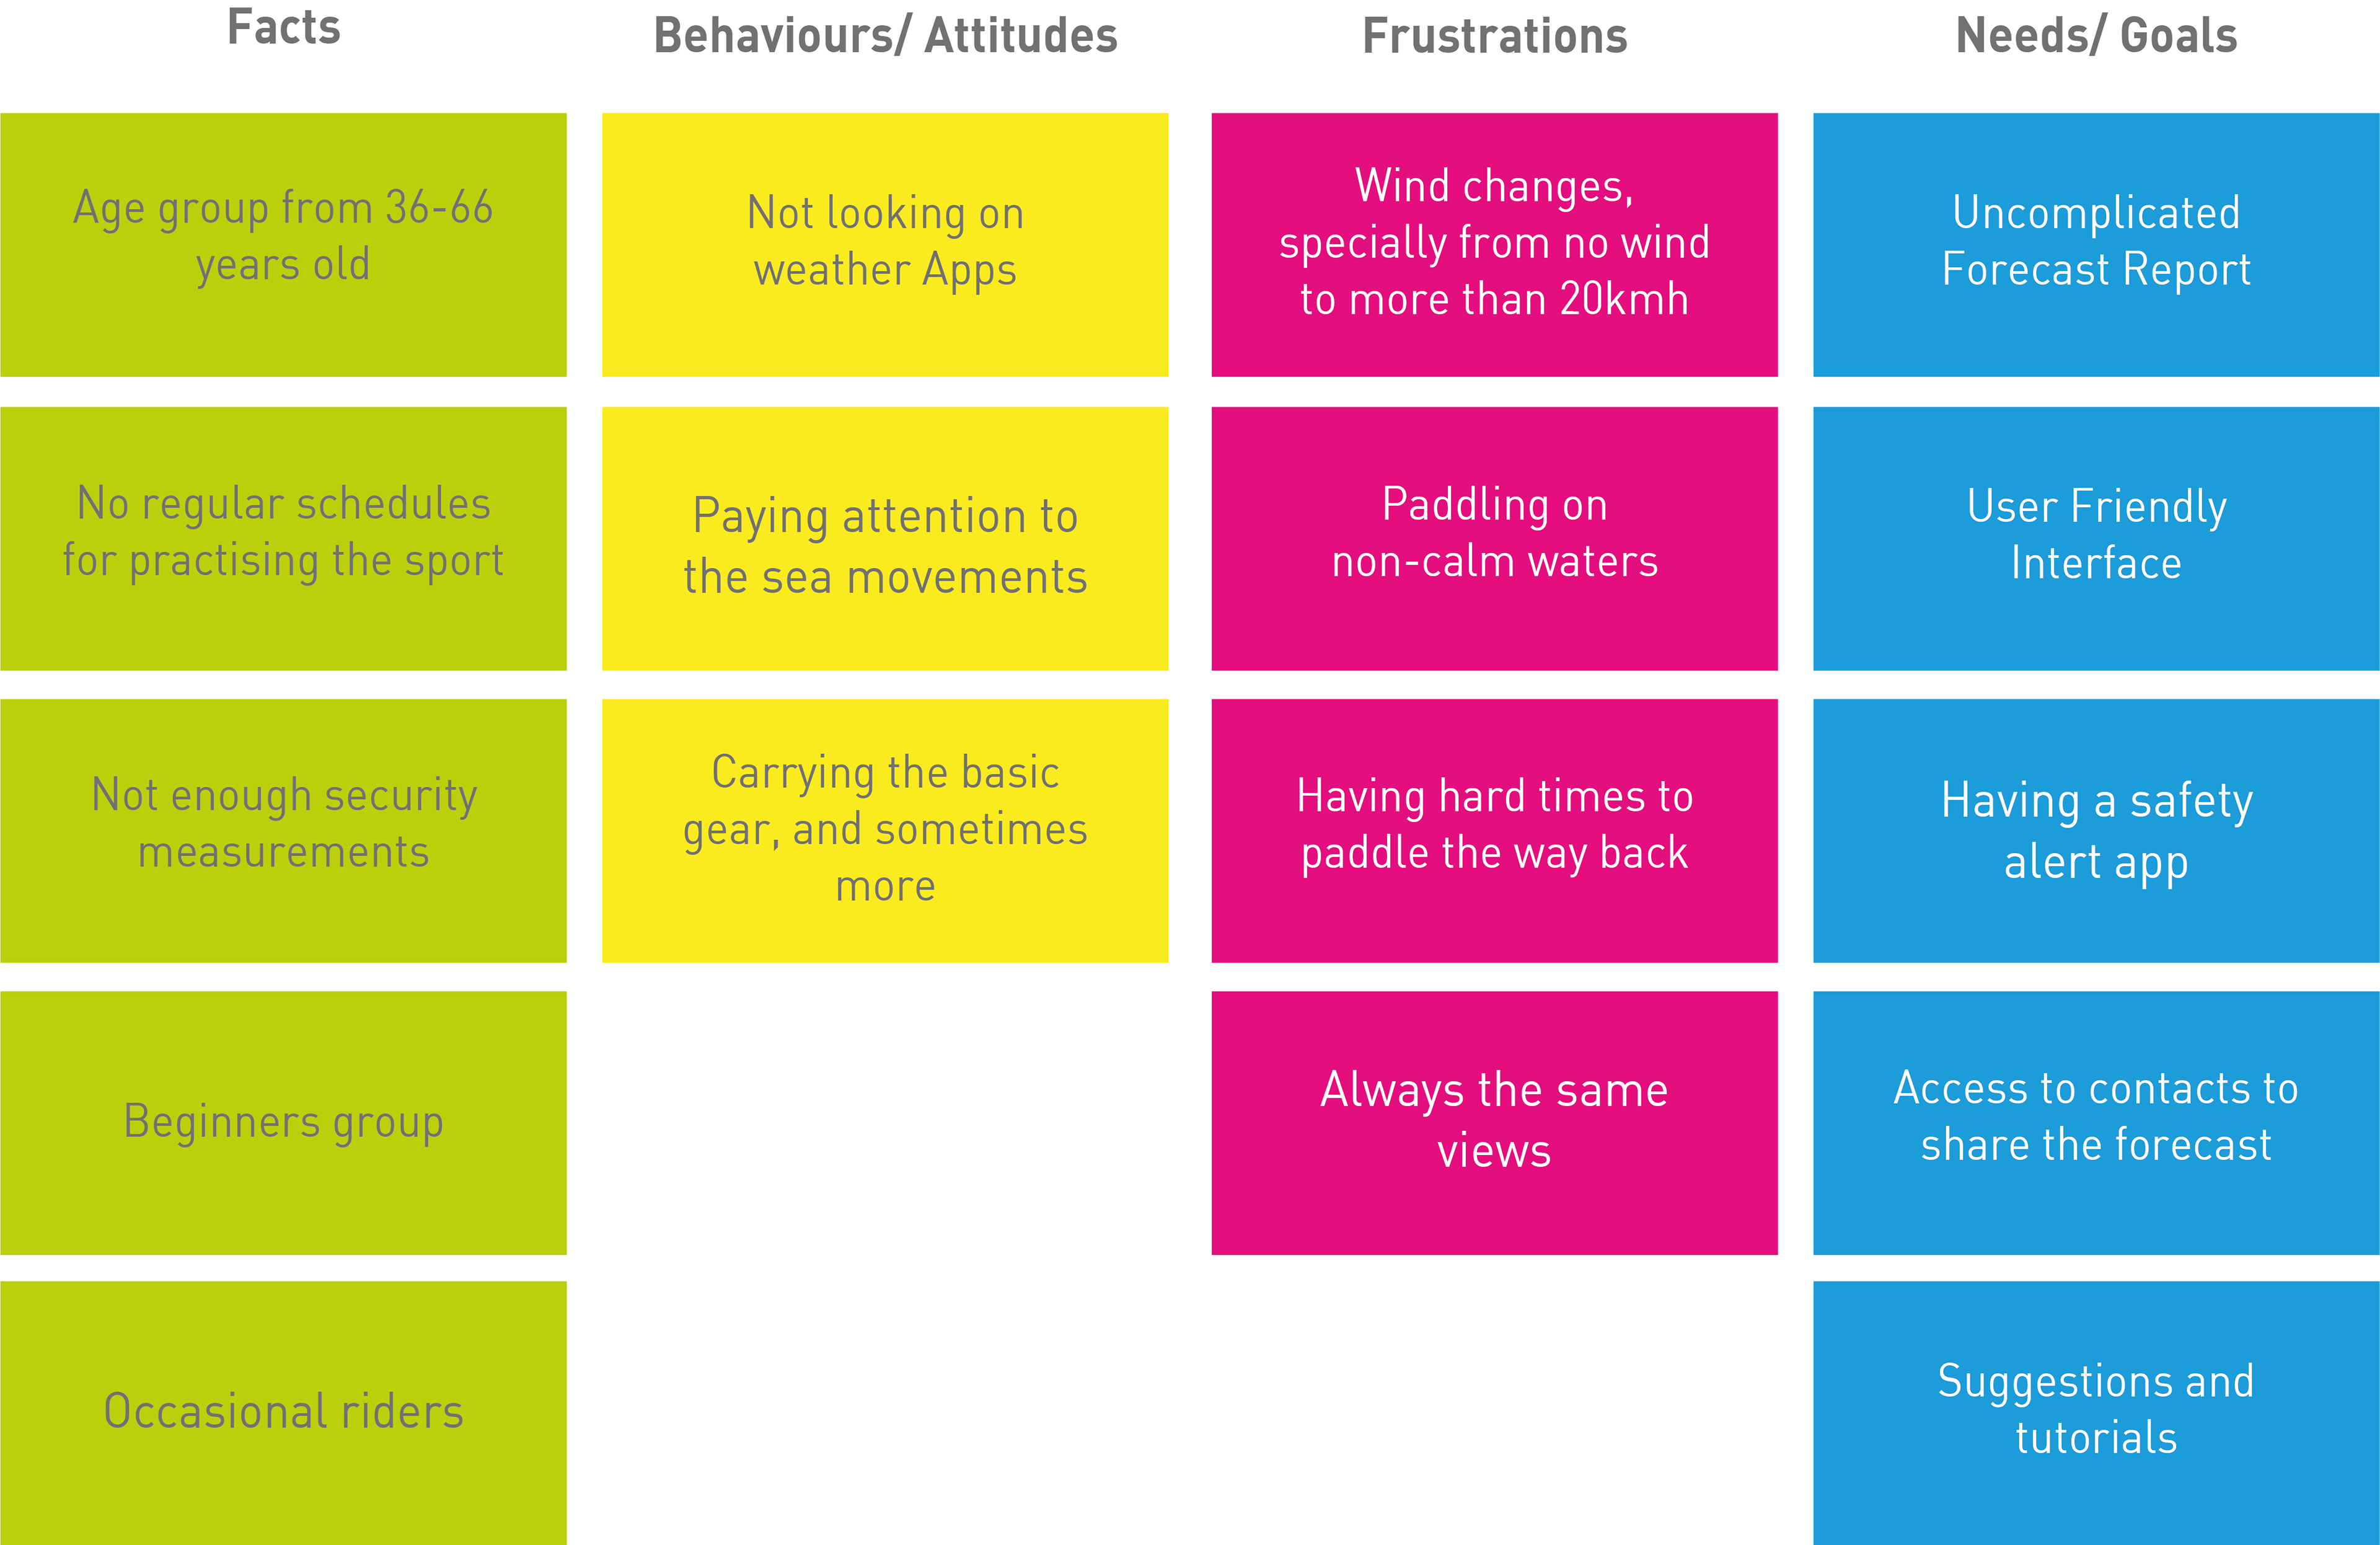
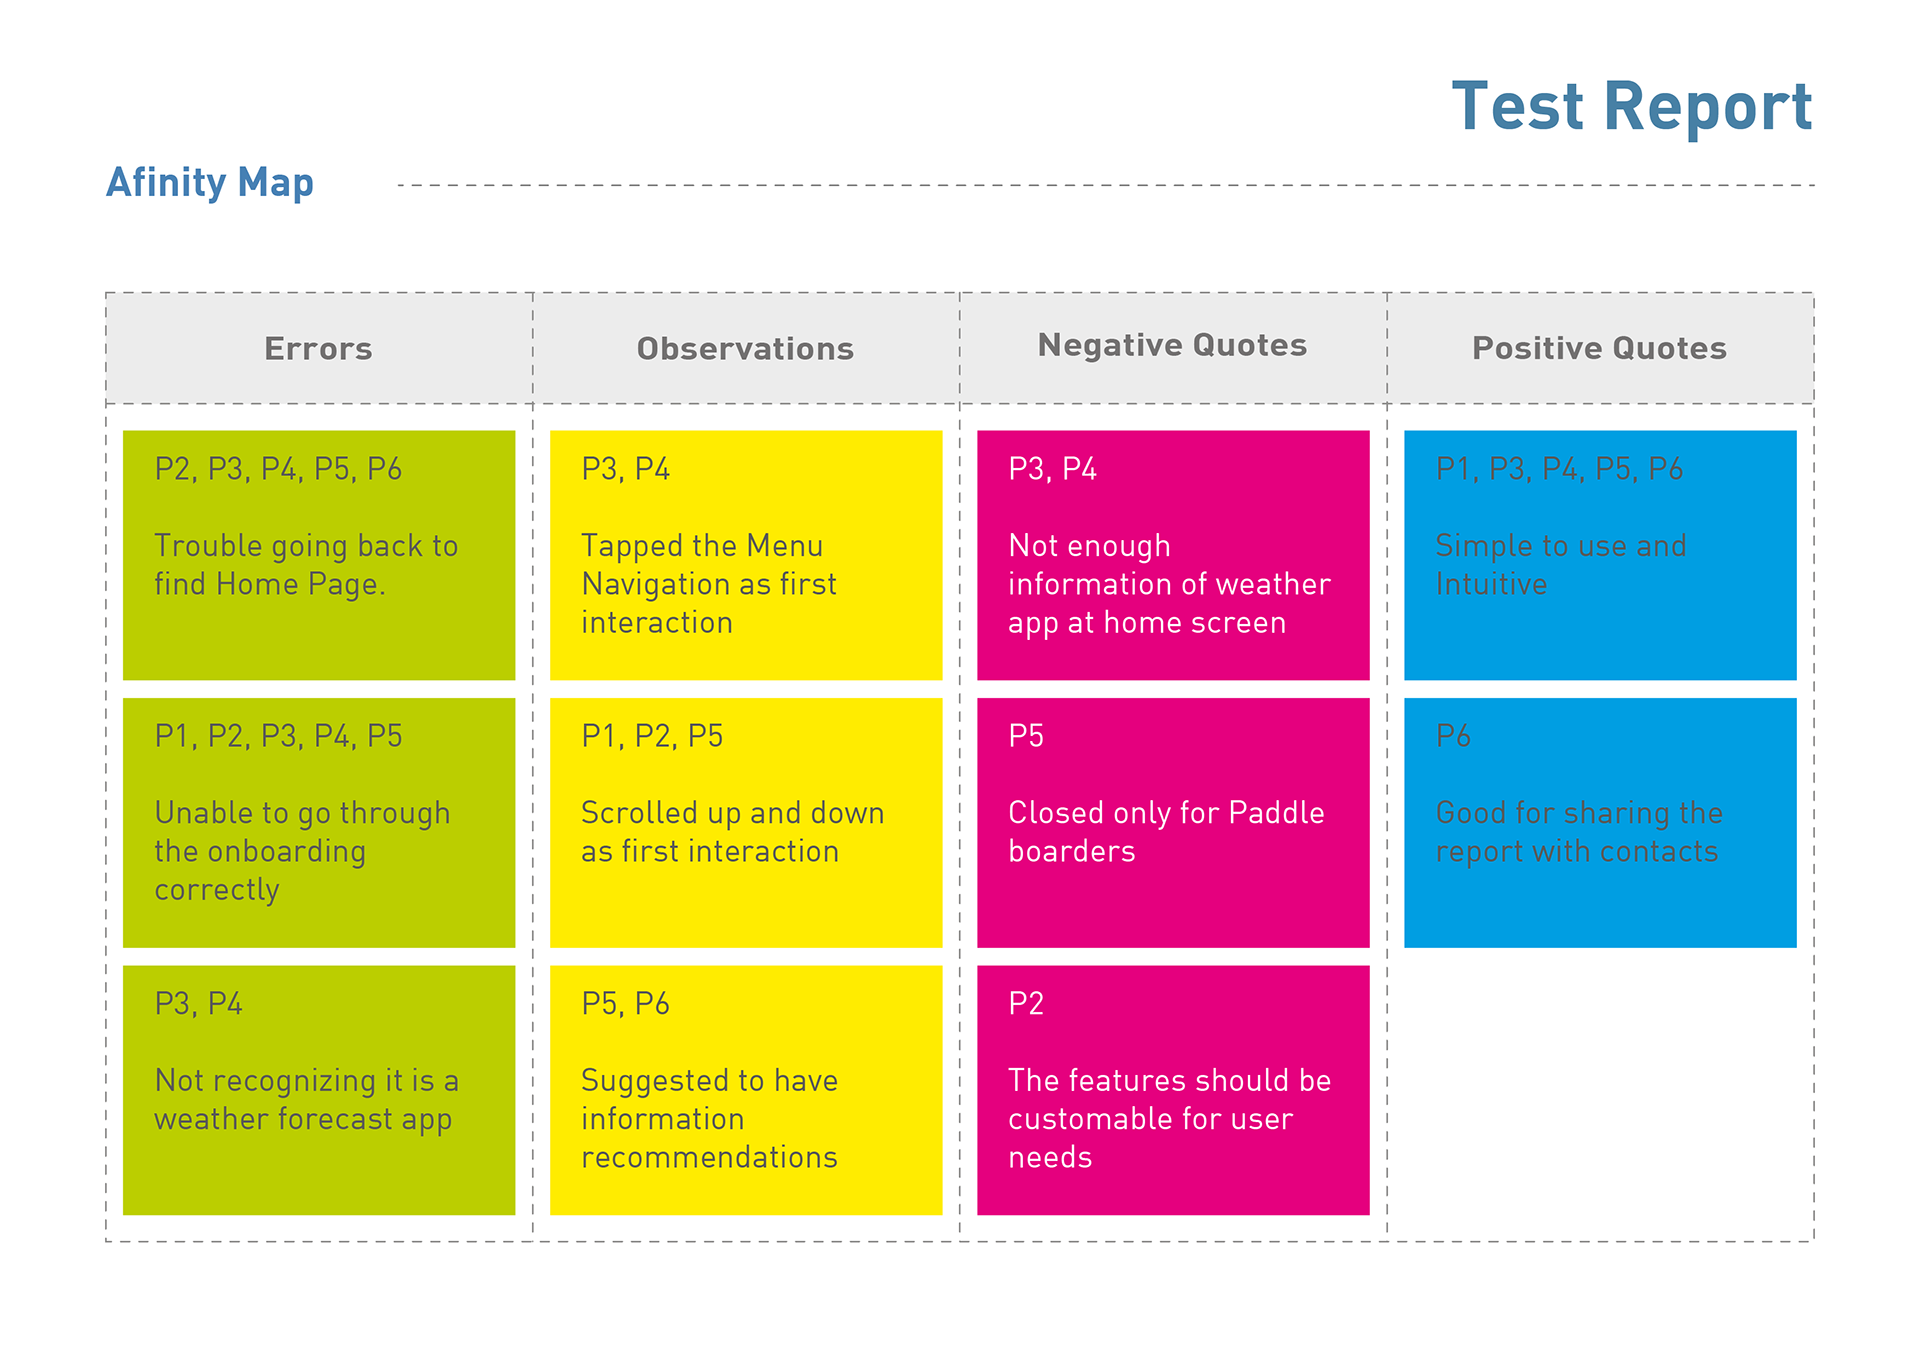
Affinity Map
To gather all the information obtained from the users Interviews using Affinity map was a great way to visualise the big picture.
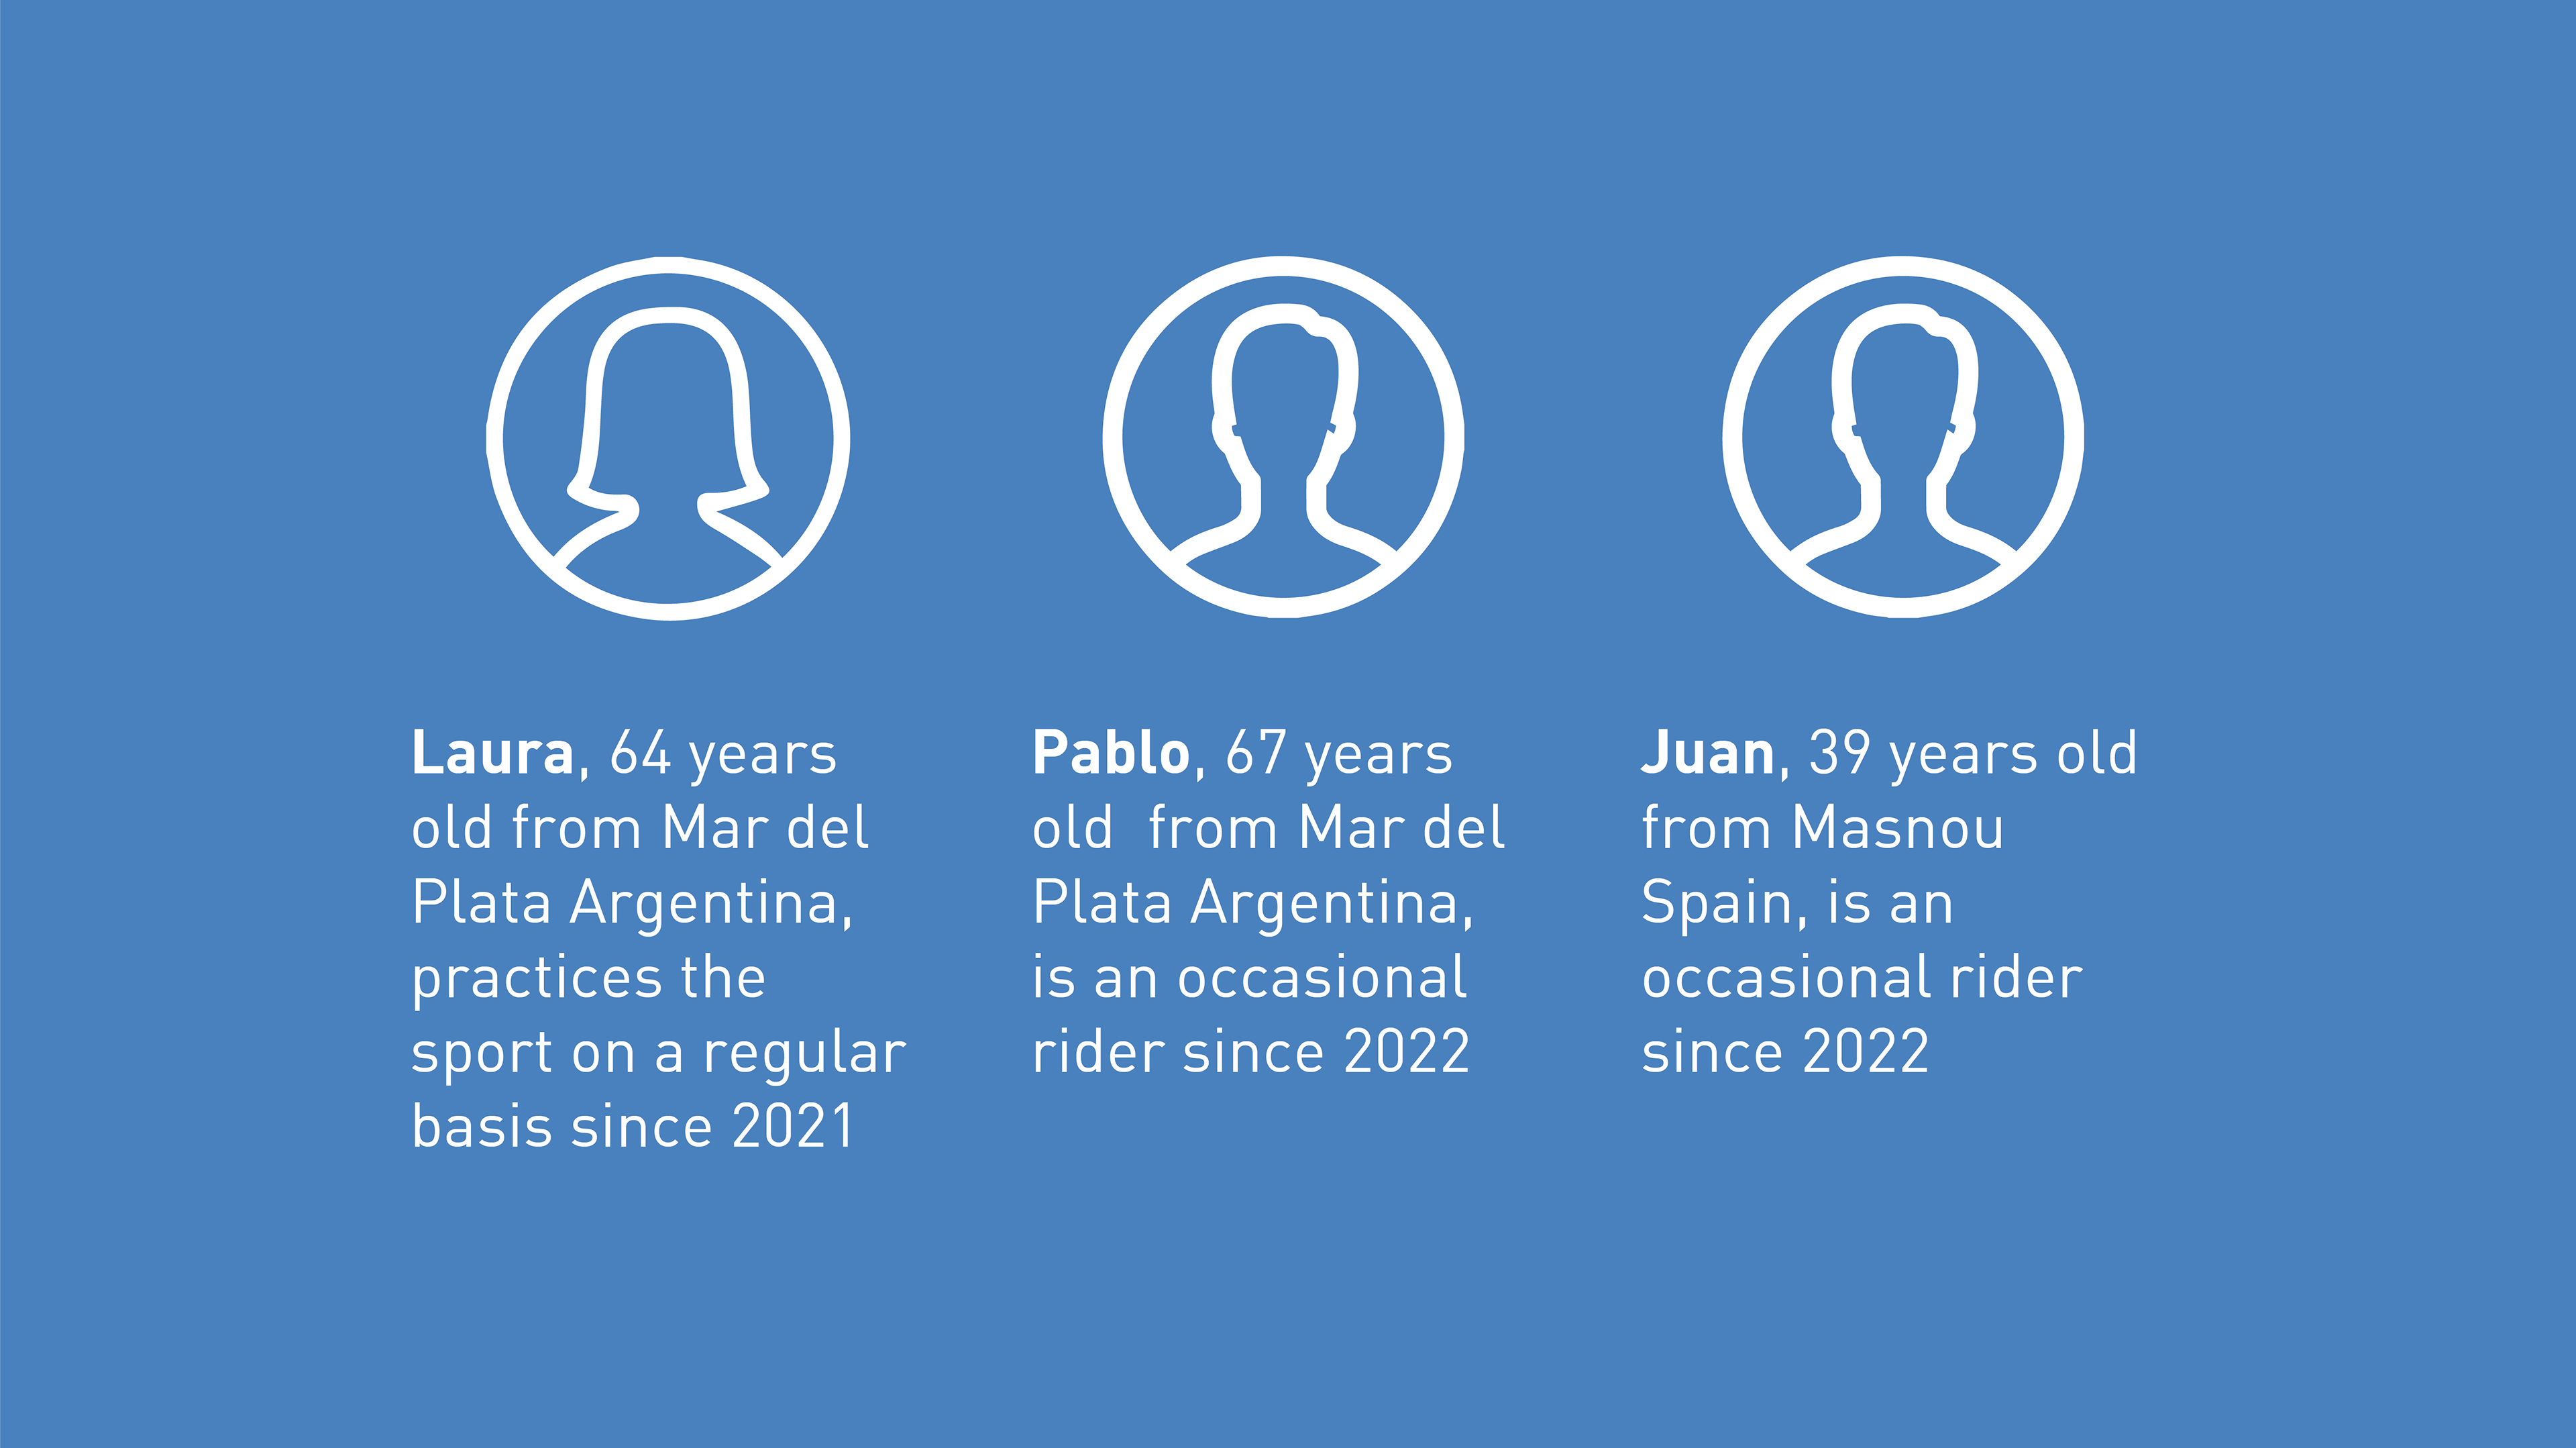
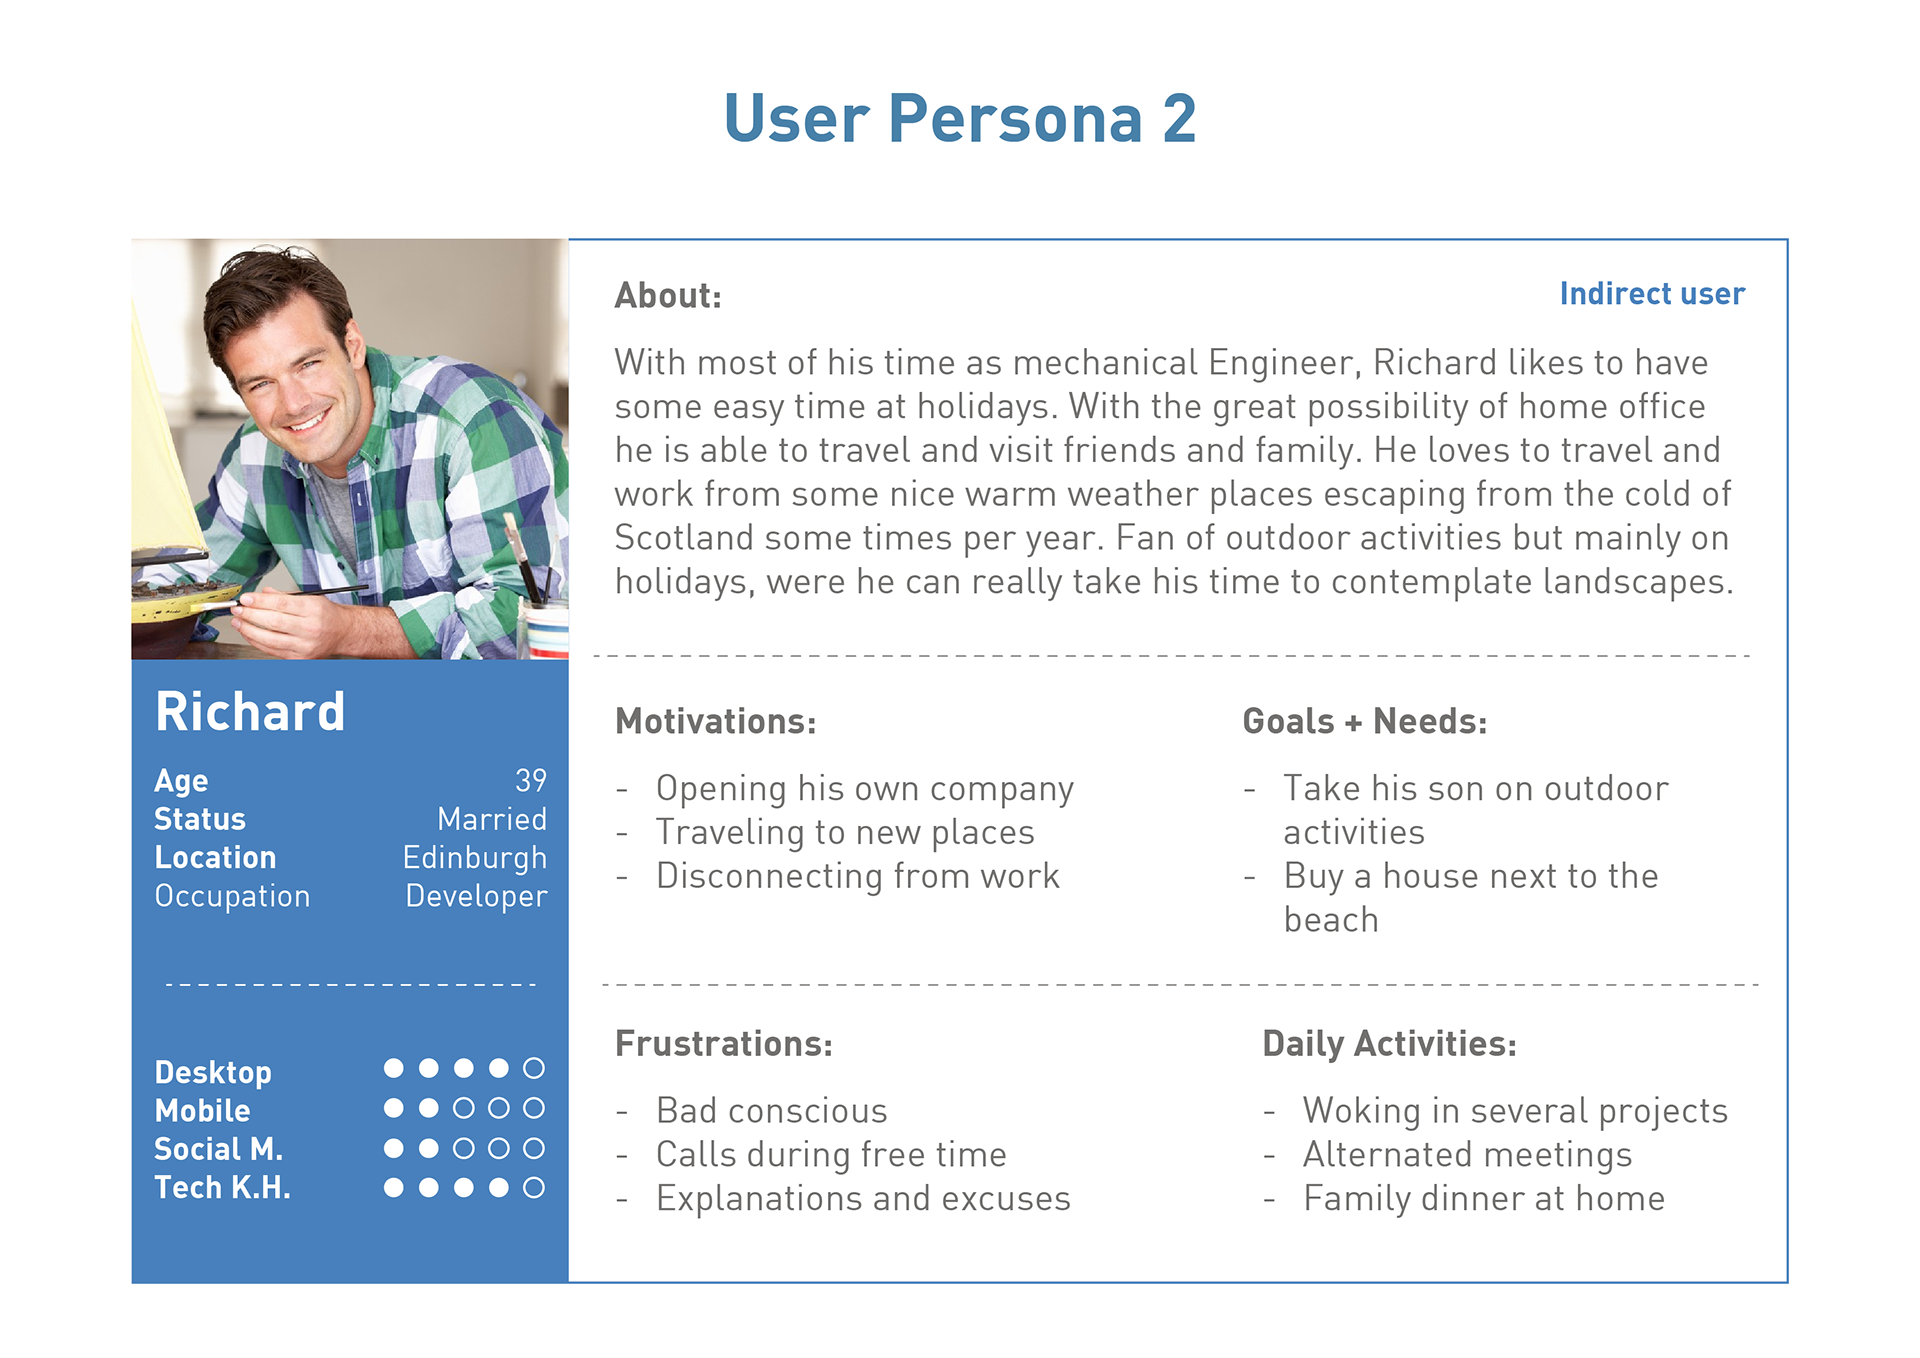
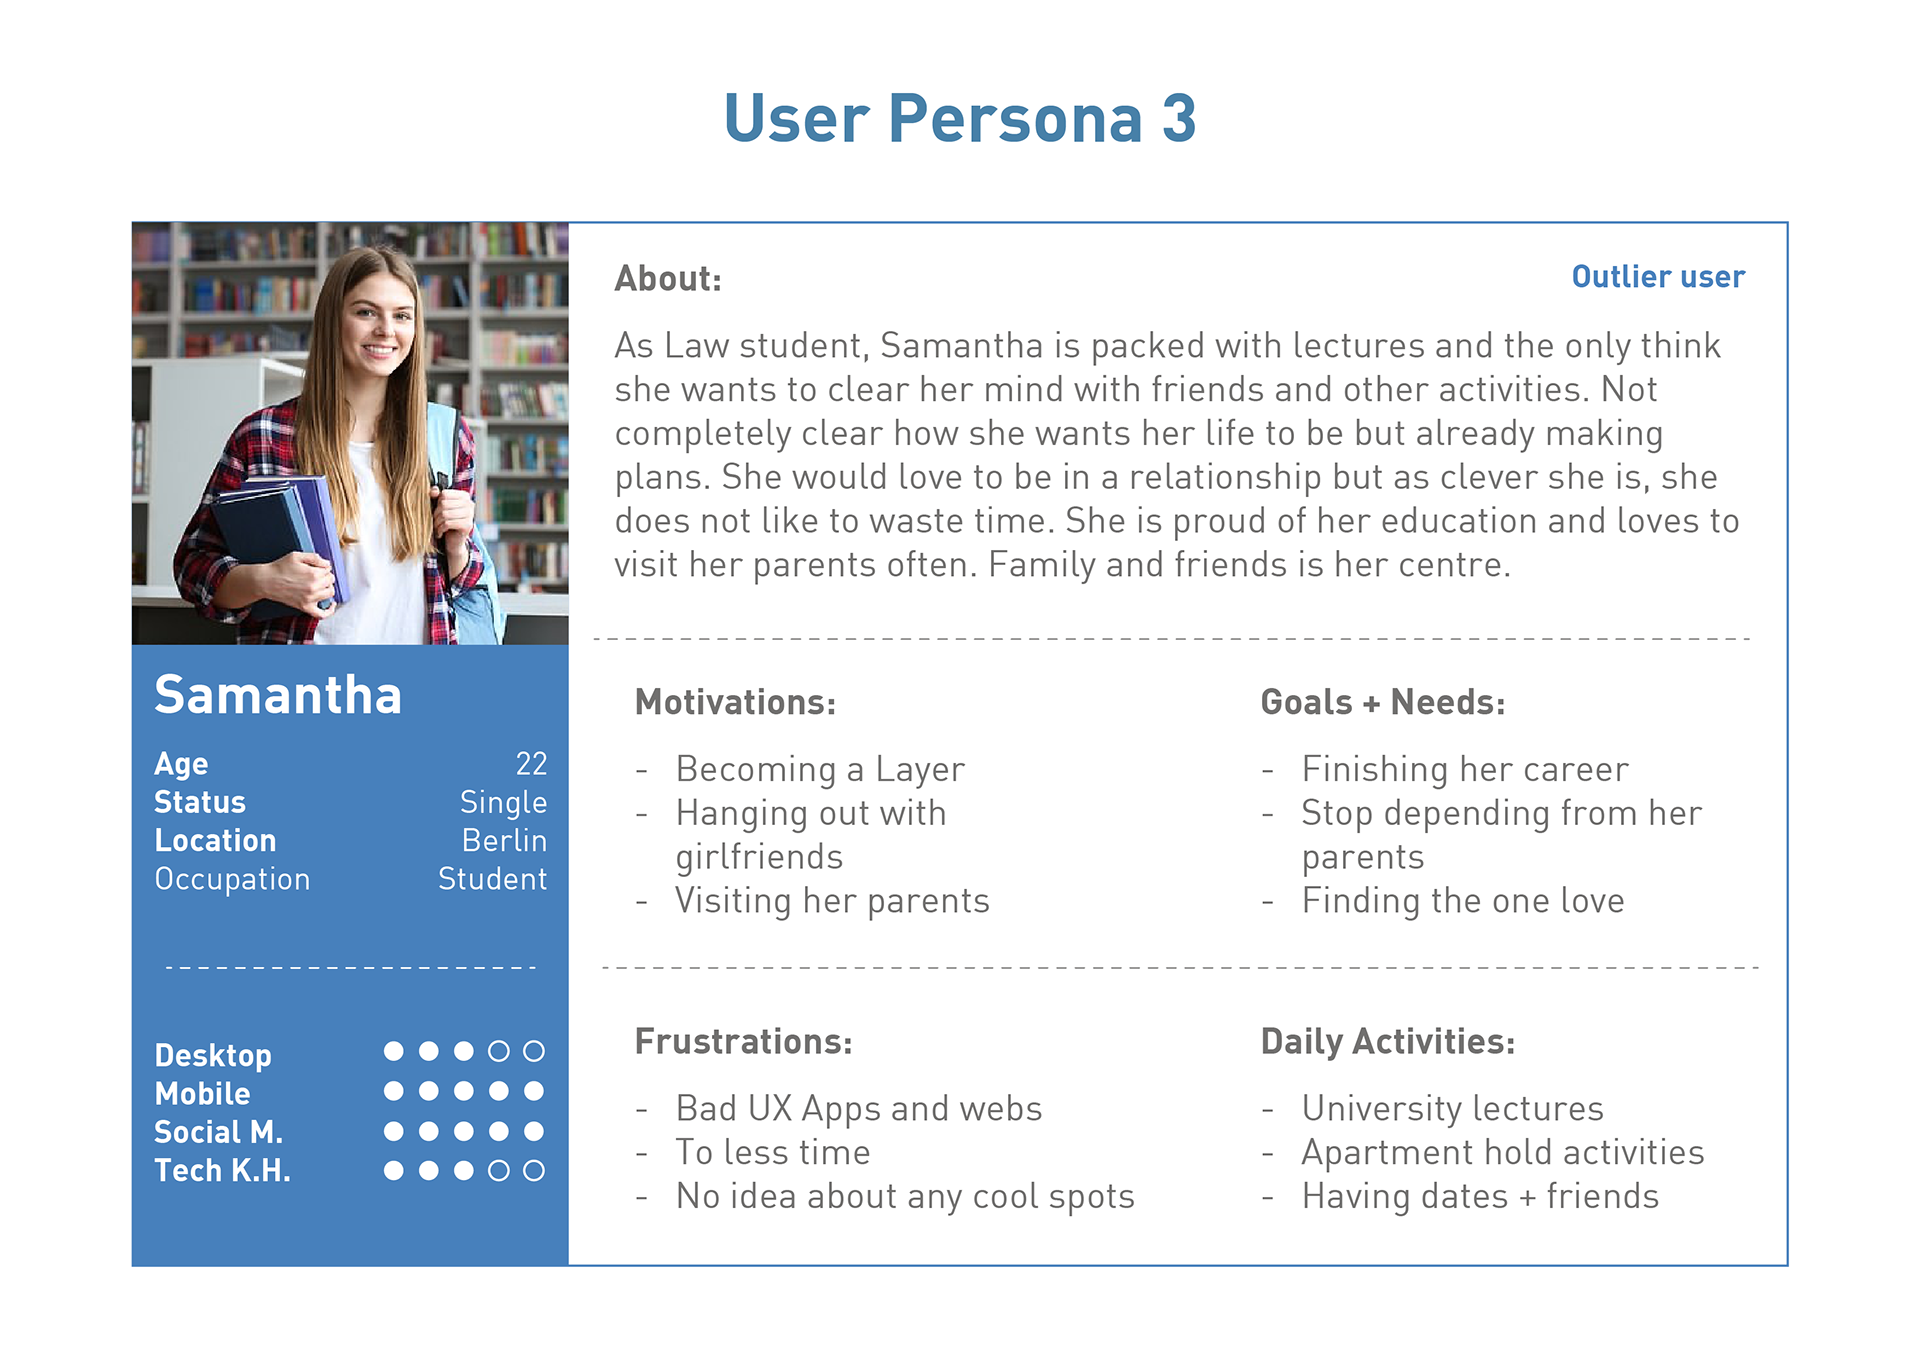
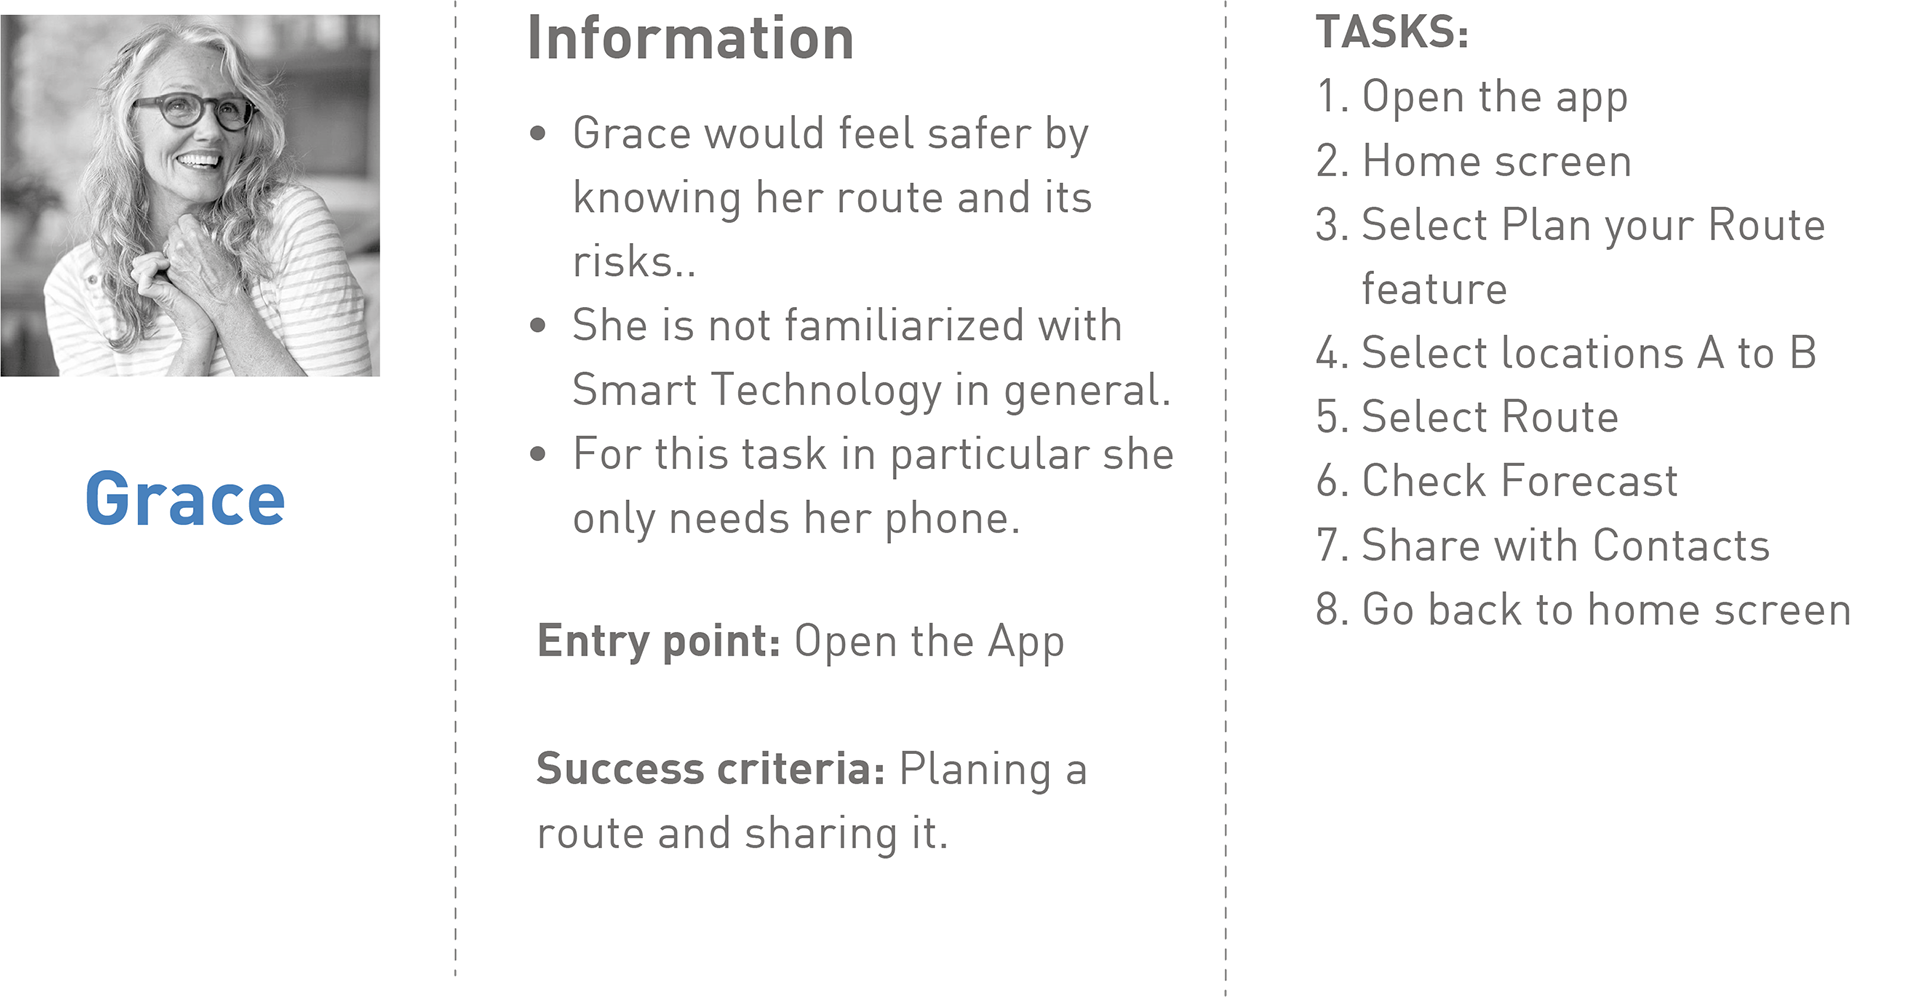
User Personas
As result of all the data collected, it was important to bring that information to live somehow and developing User Personas is the more effective way.
The users a diagramed in three levels: Ideal User, Indirect User and Outlier User.

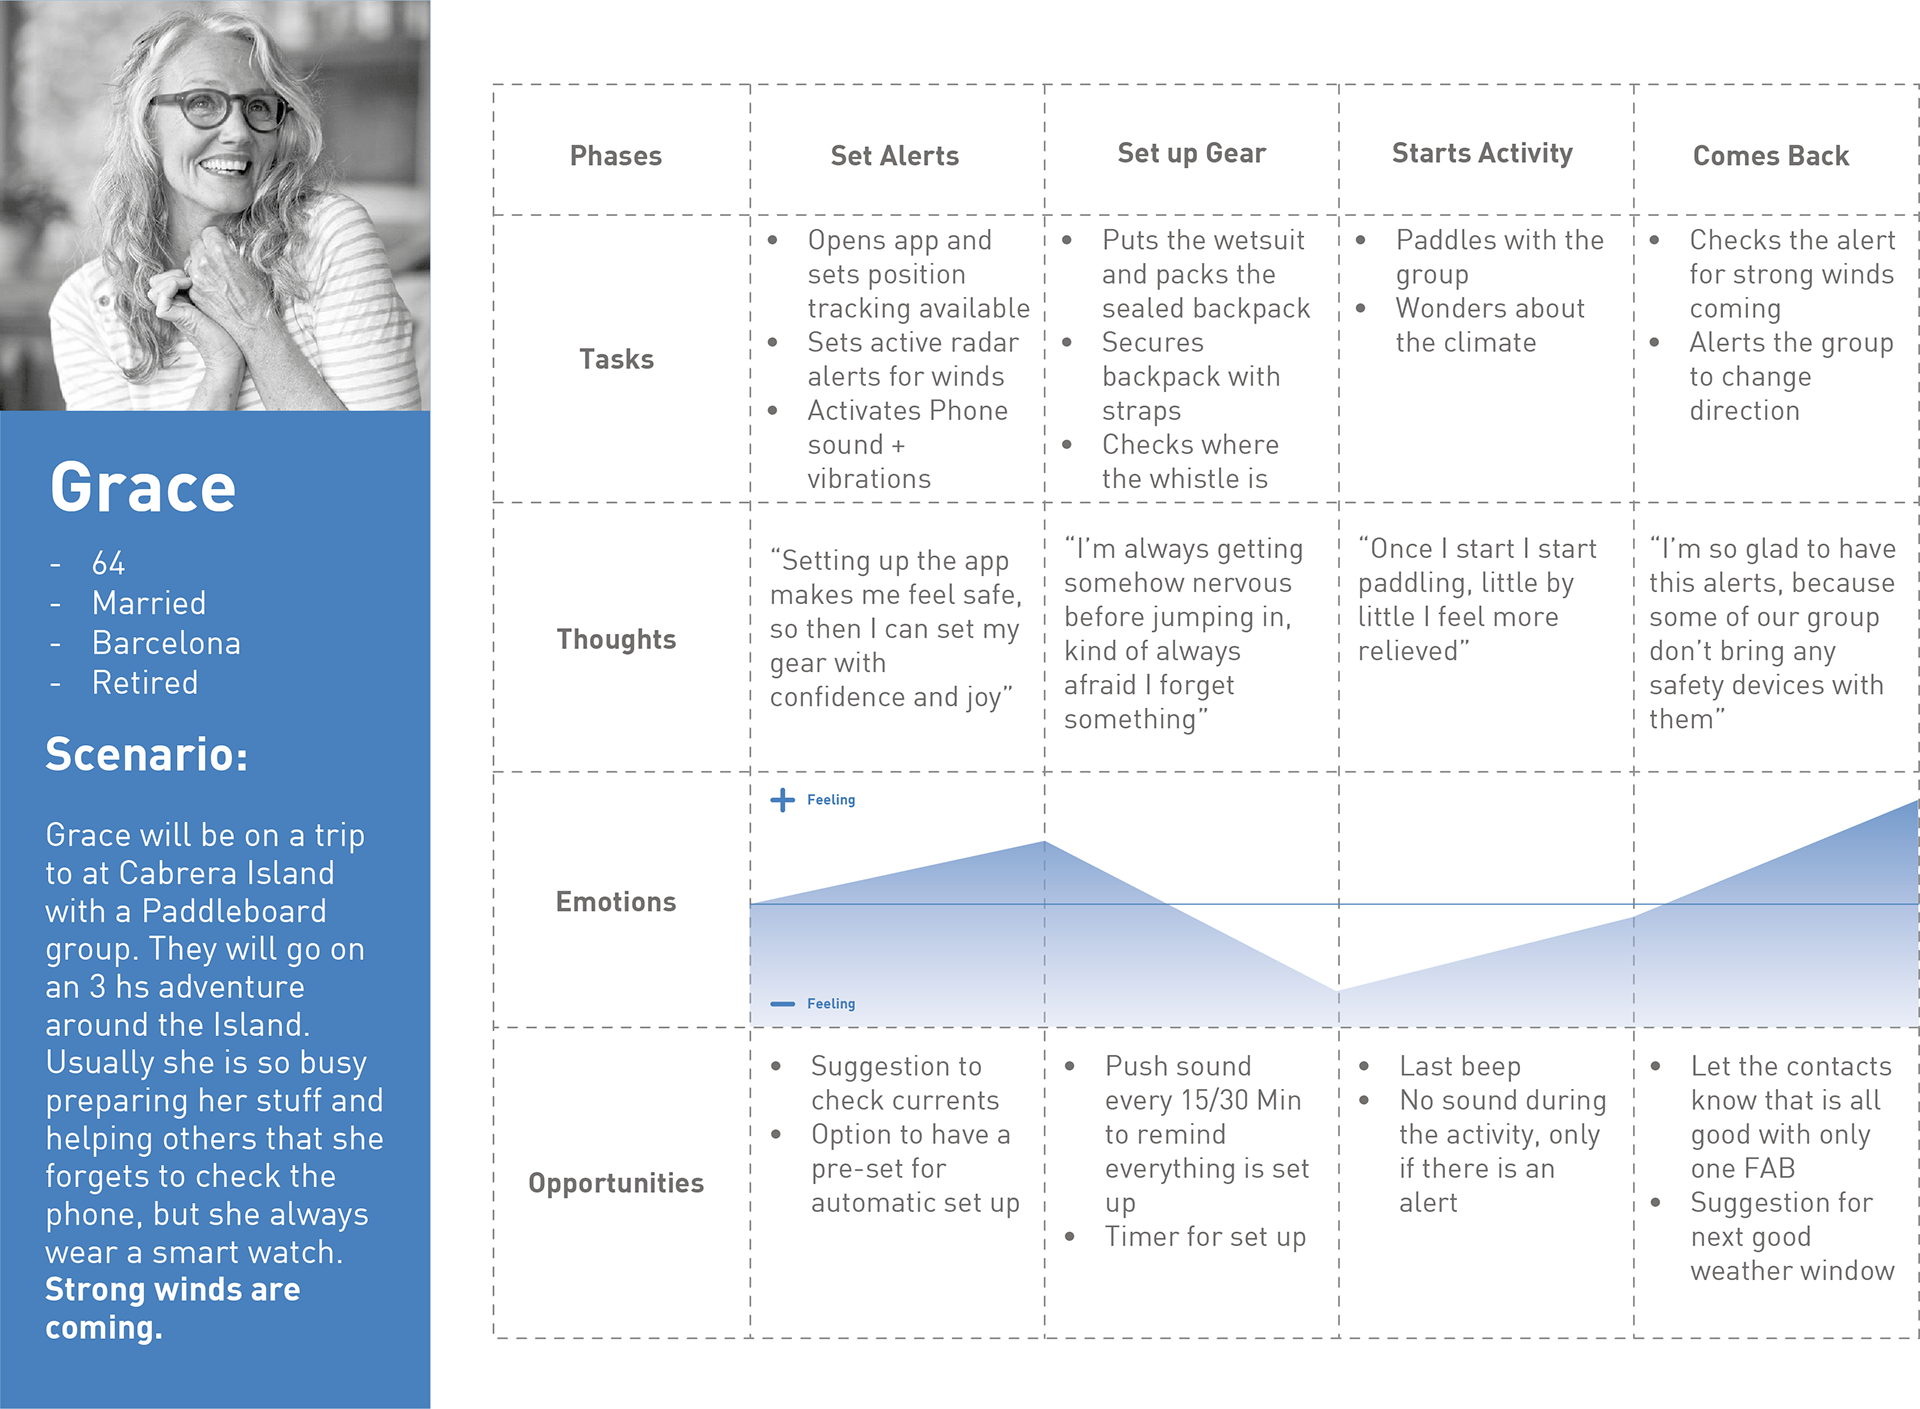
User Journey
Based on the Ideal User and Indirect User from User Personas, I developed 2 different User Journeys to have a more clear idea on how these users will experience the activity, therefor to develop the features more accordingly.

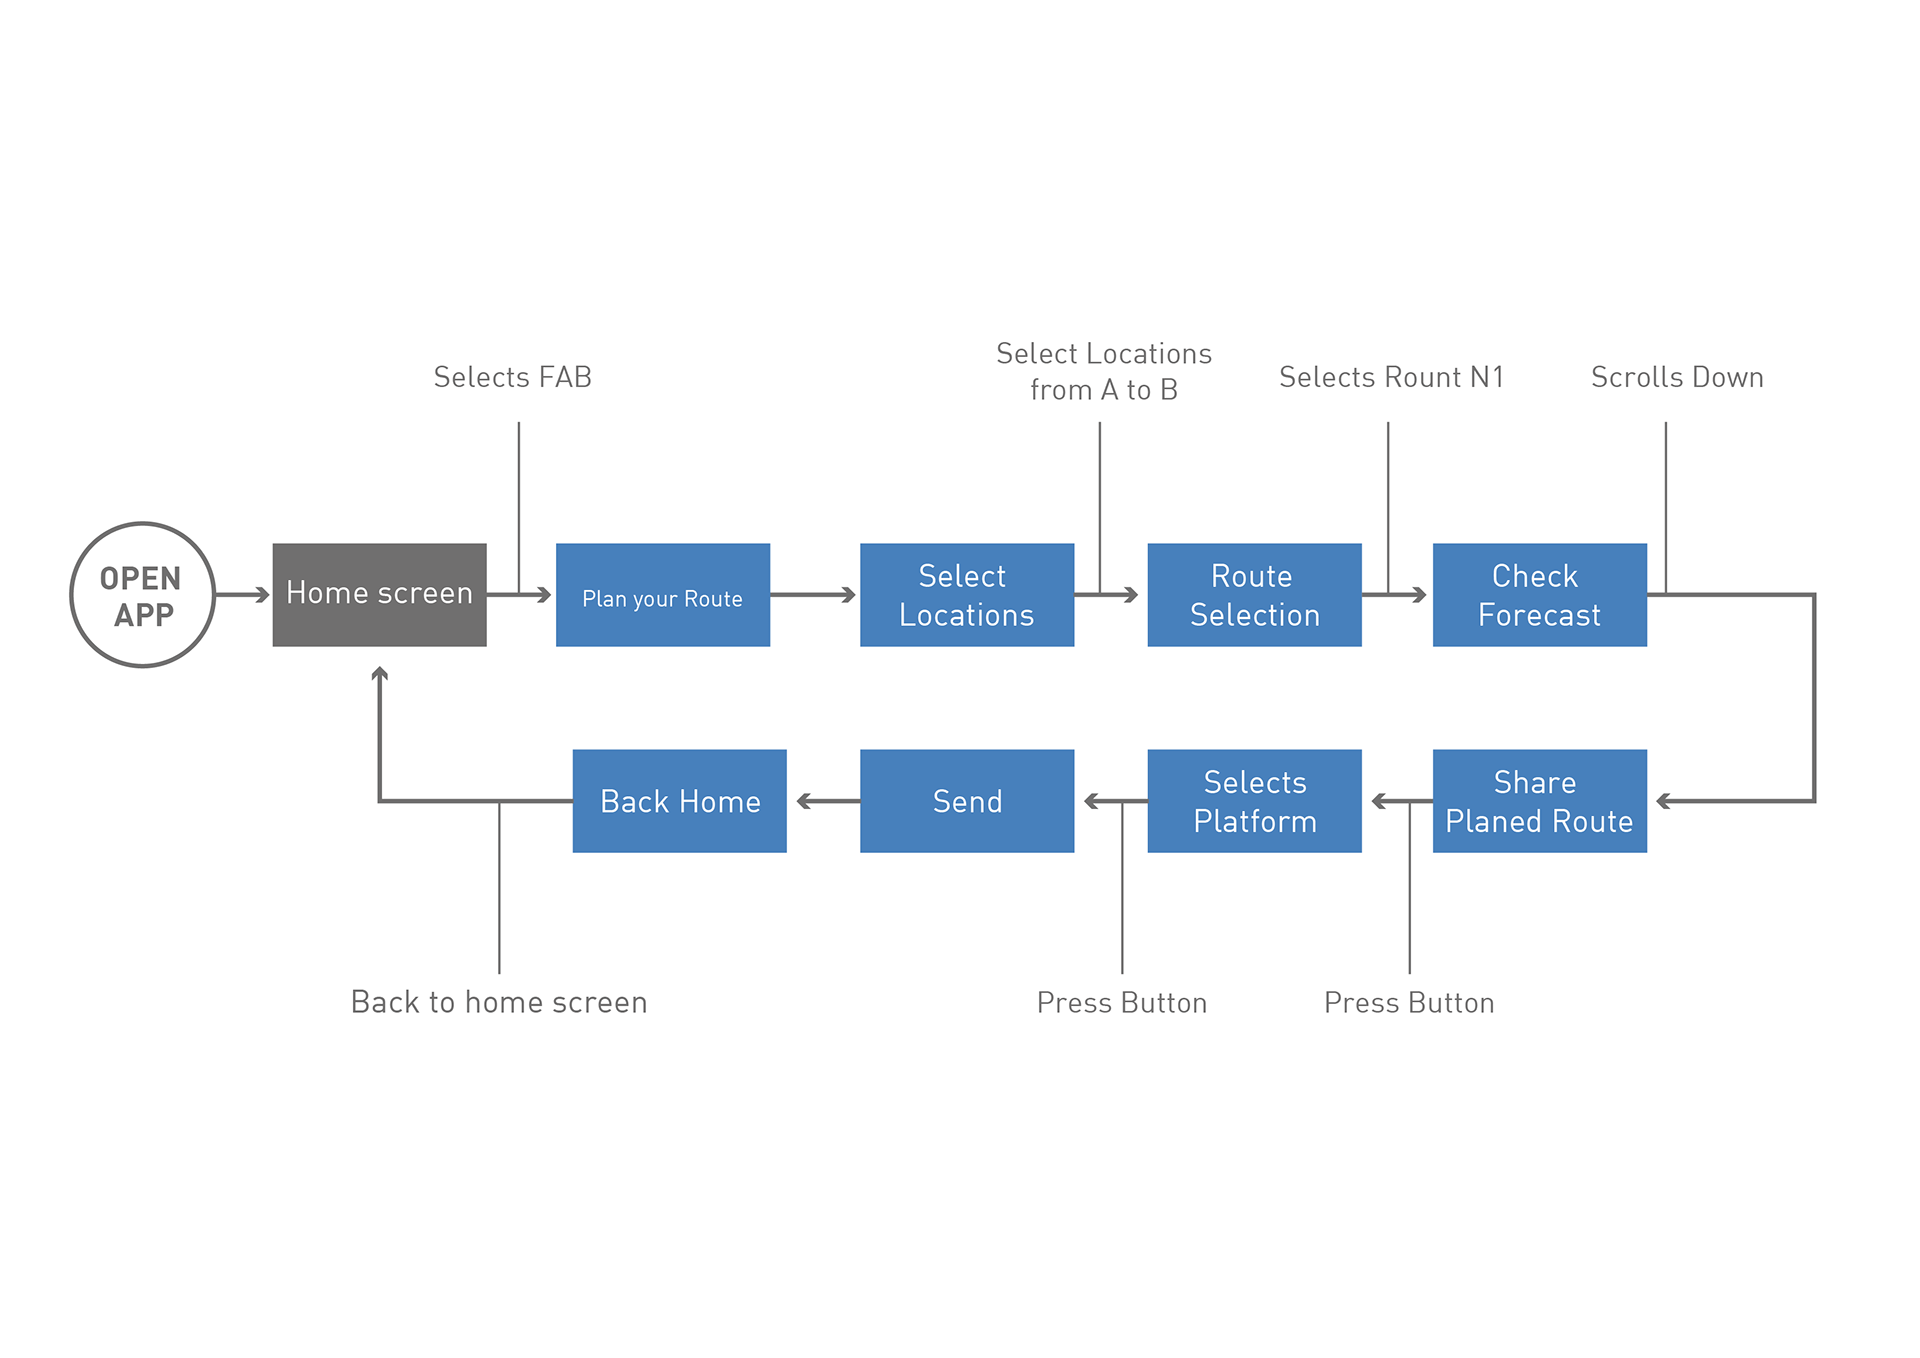
User Flow
To picture how the process will be, I developed Users flows for the current users personas while using the app features. In this case below we can see the Ideal User Planning a Route before jumping into an adventure.
Information Architecture
Something that I enjoyed a lot was developing the site map, specially because it really accomplish its function of development guide. I printed it out, hanged on the wall using it all along for the rest of my design process.

Wireframing
This was one of the most enjoyable parts of this project, specially because from complete unsureness somehow you start to find the way to have clear images of what you think the app will look like. But only possible, at least for me, by putting down the pen and rolling it over paper.
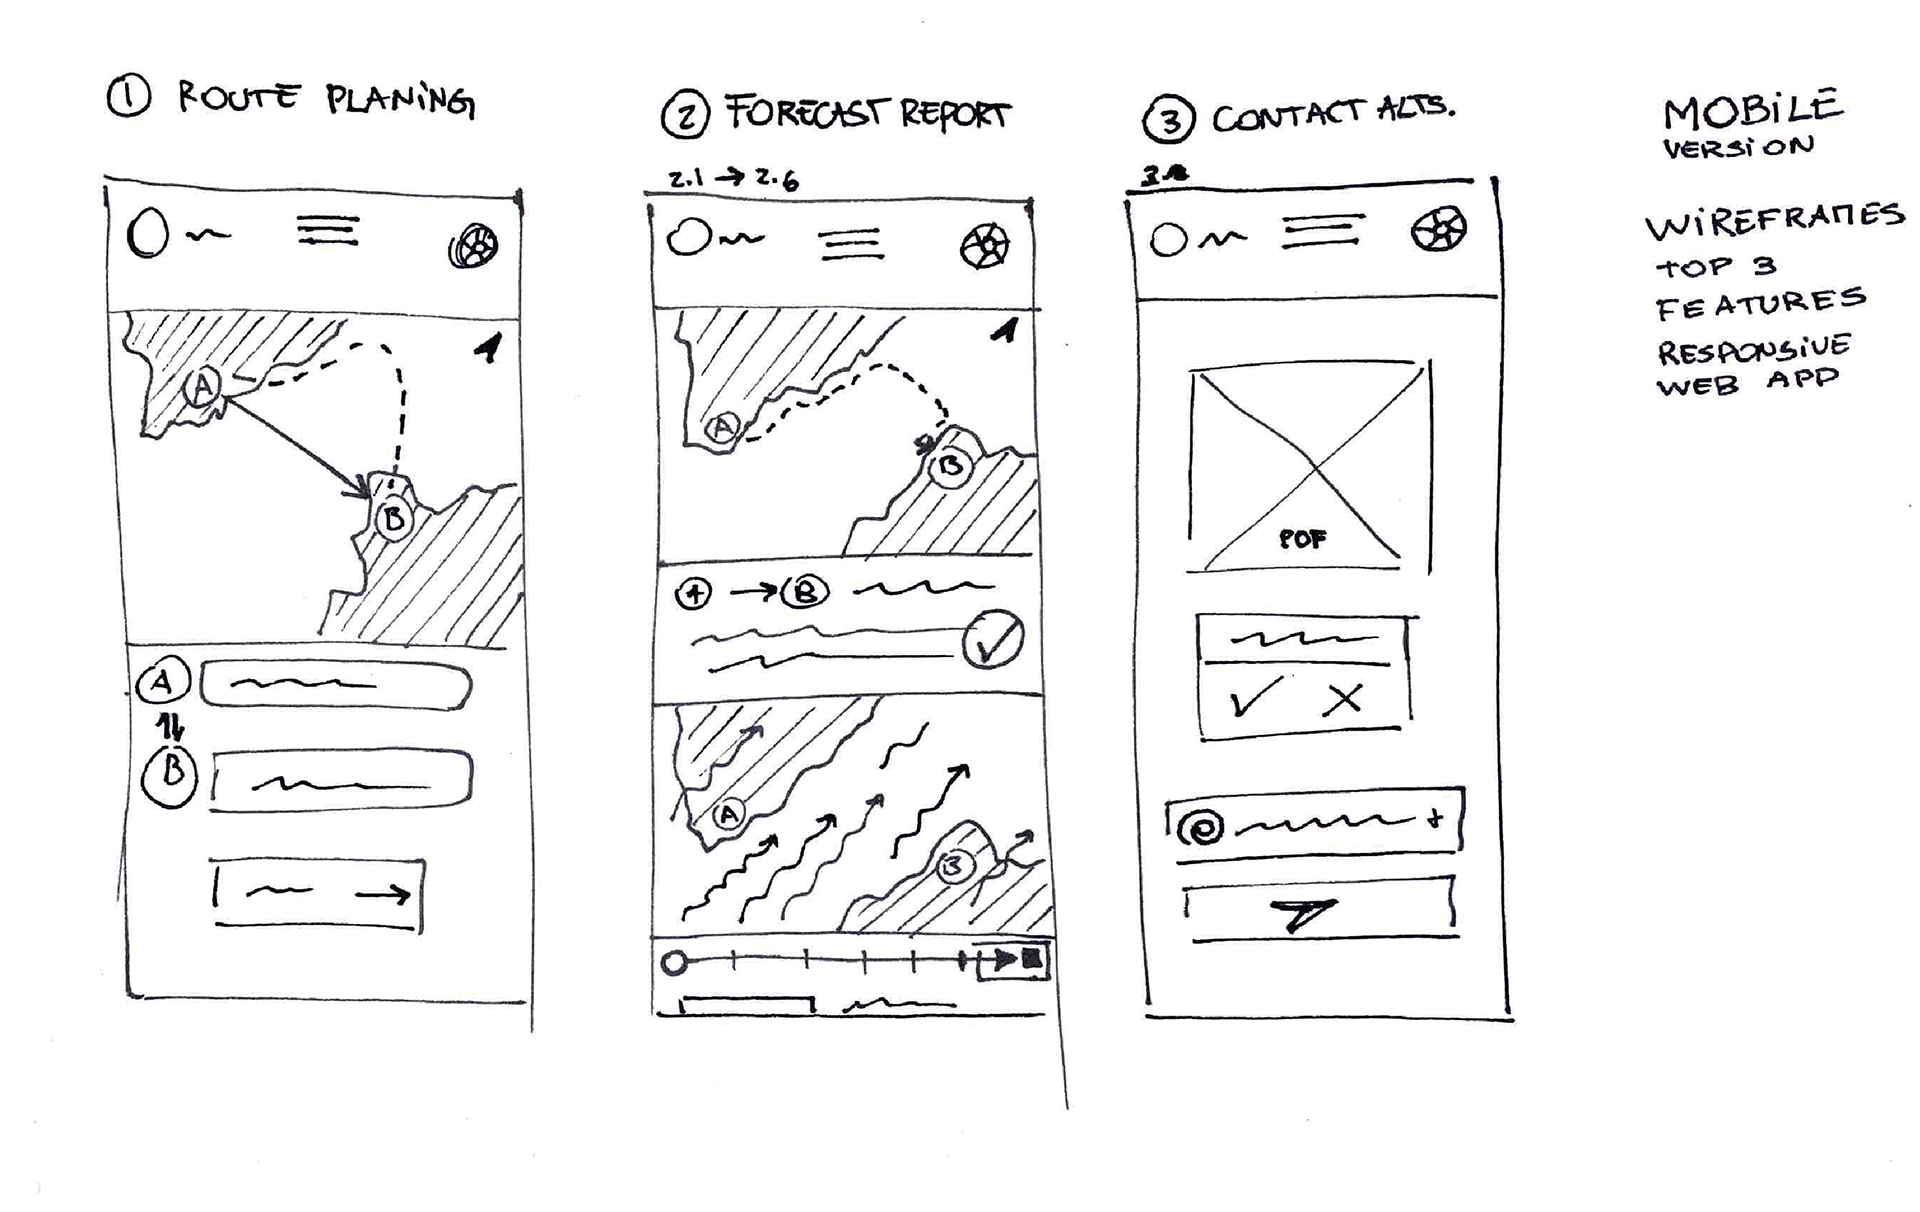
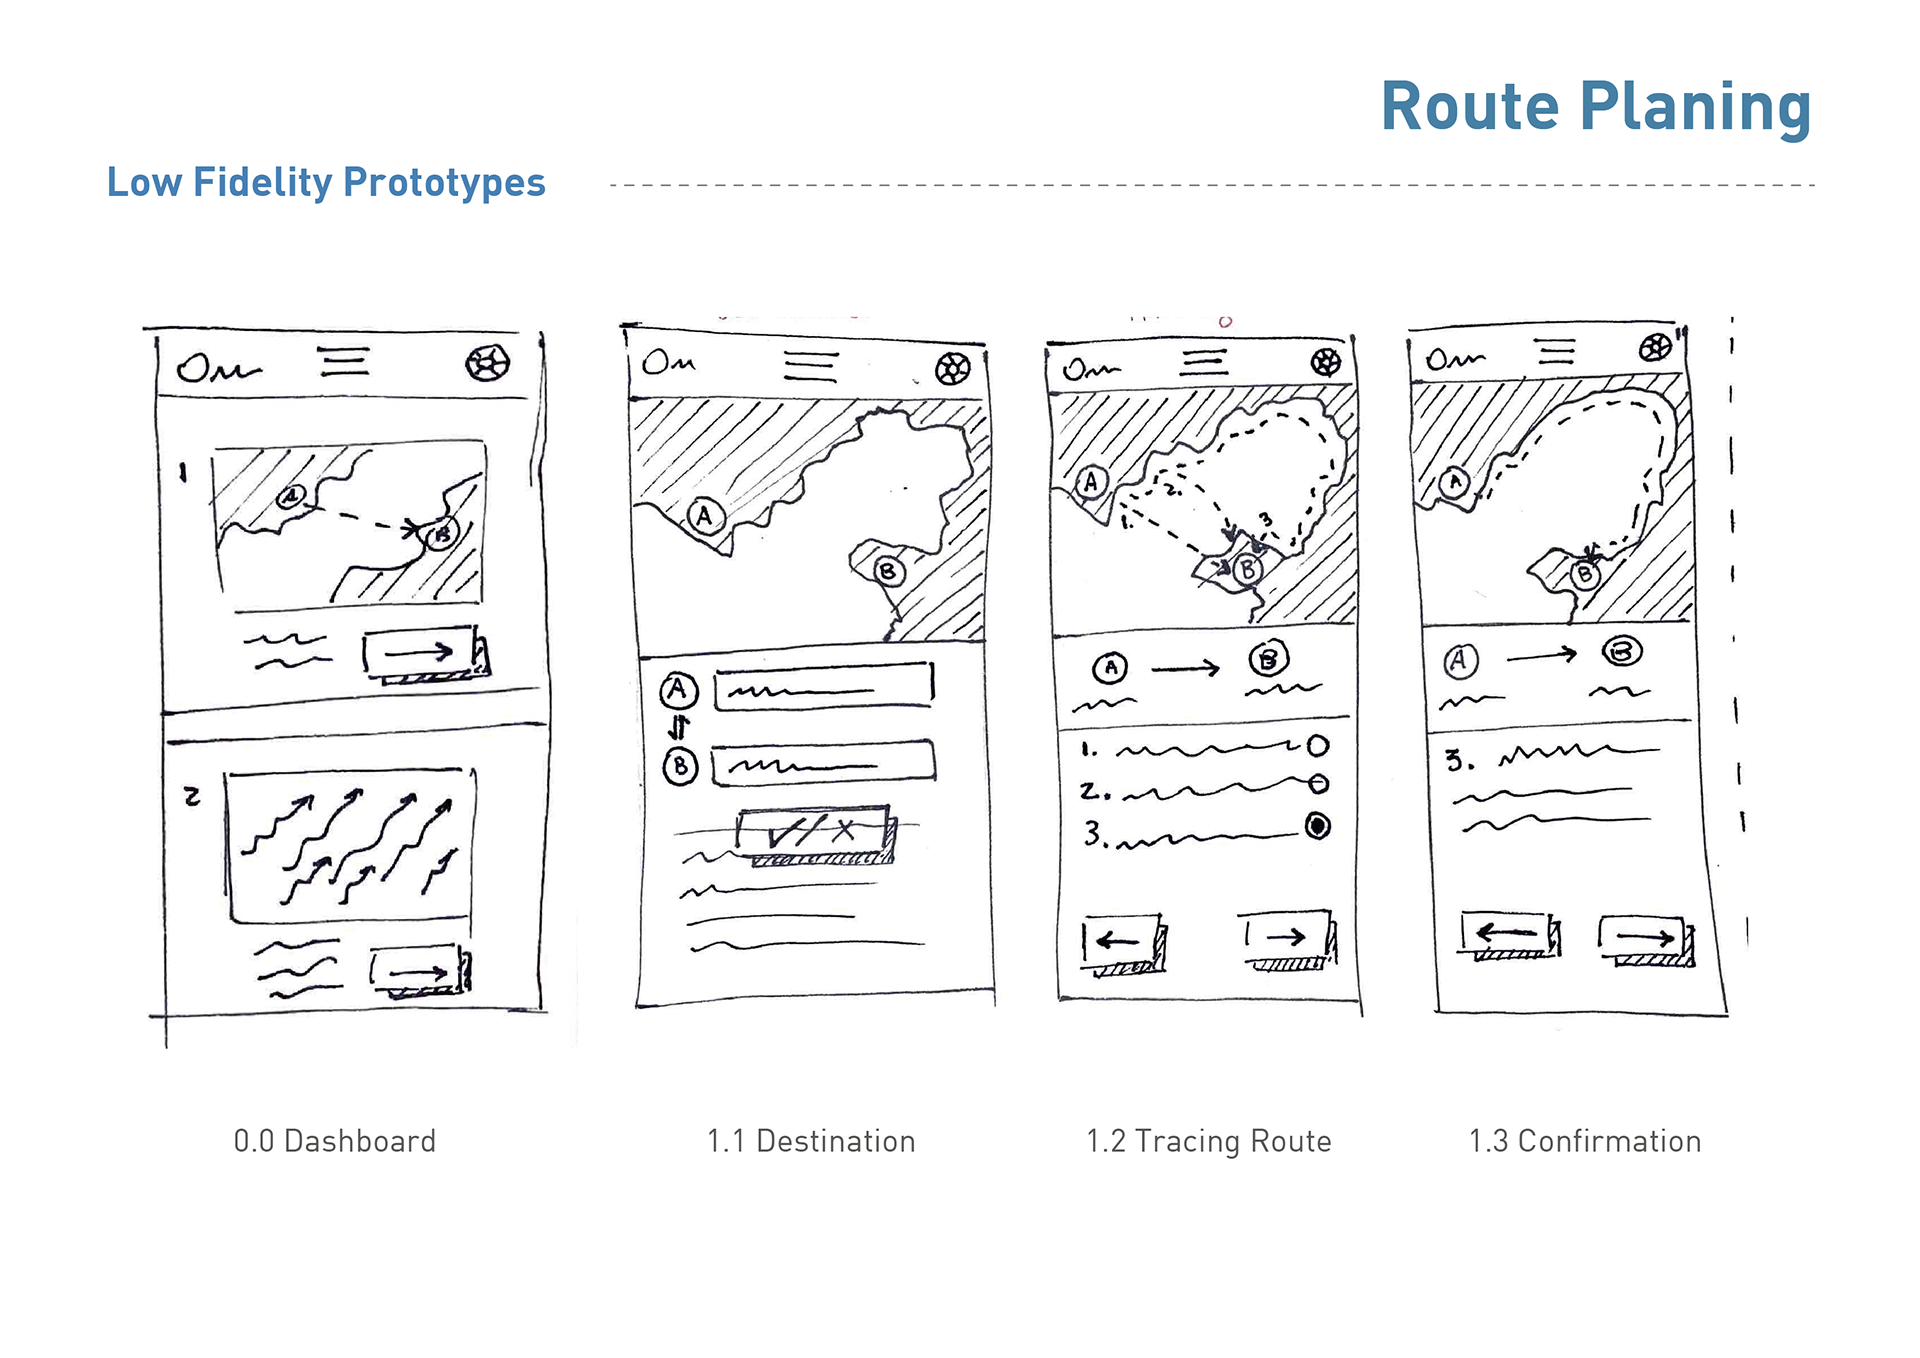
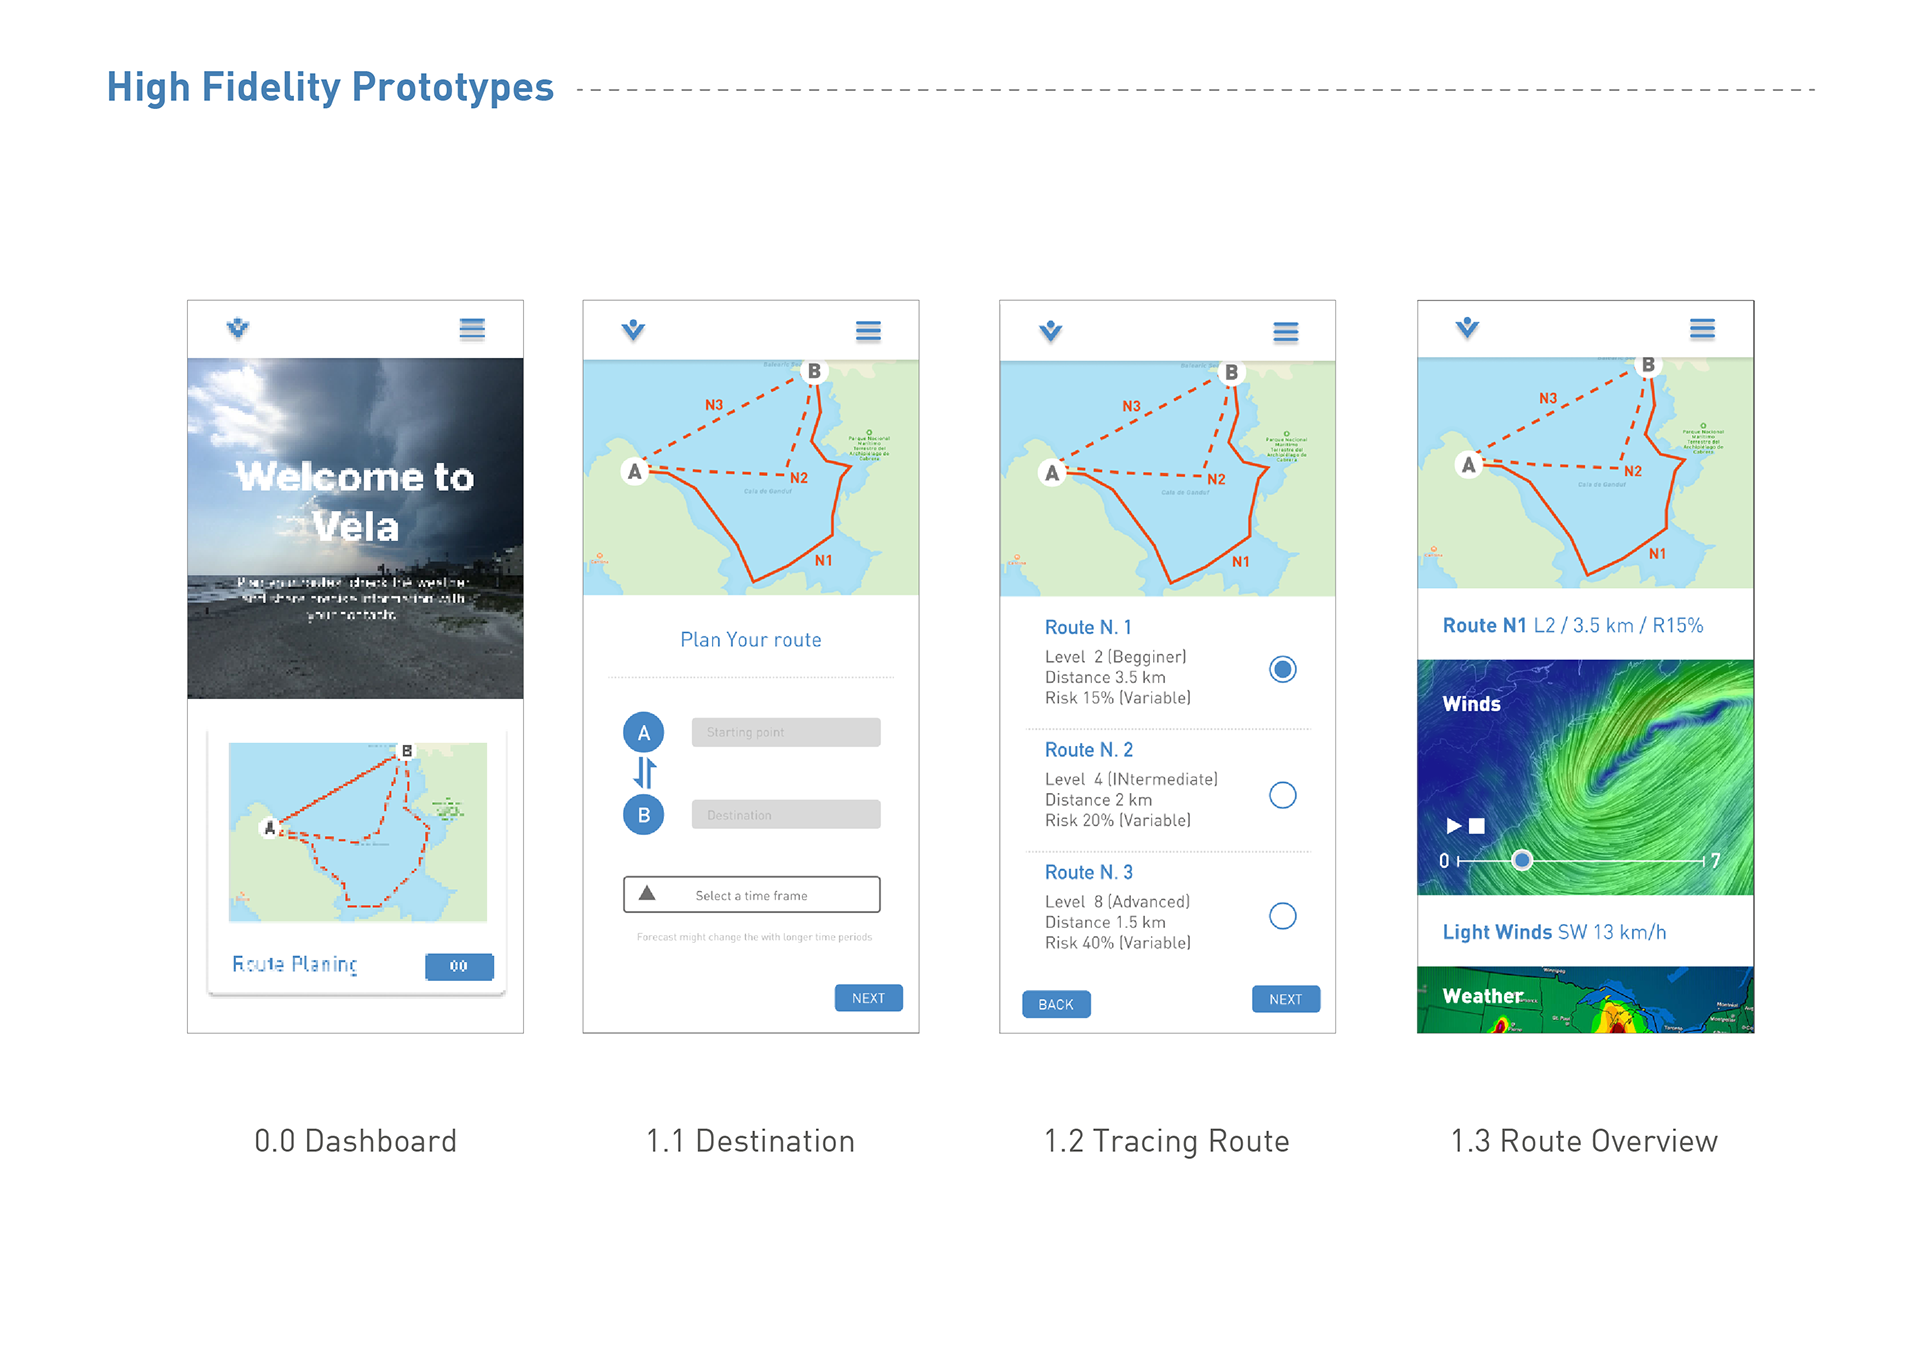
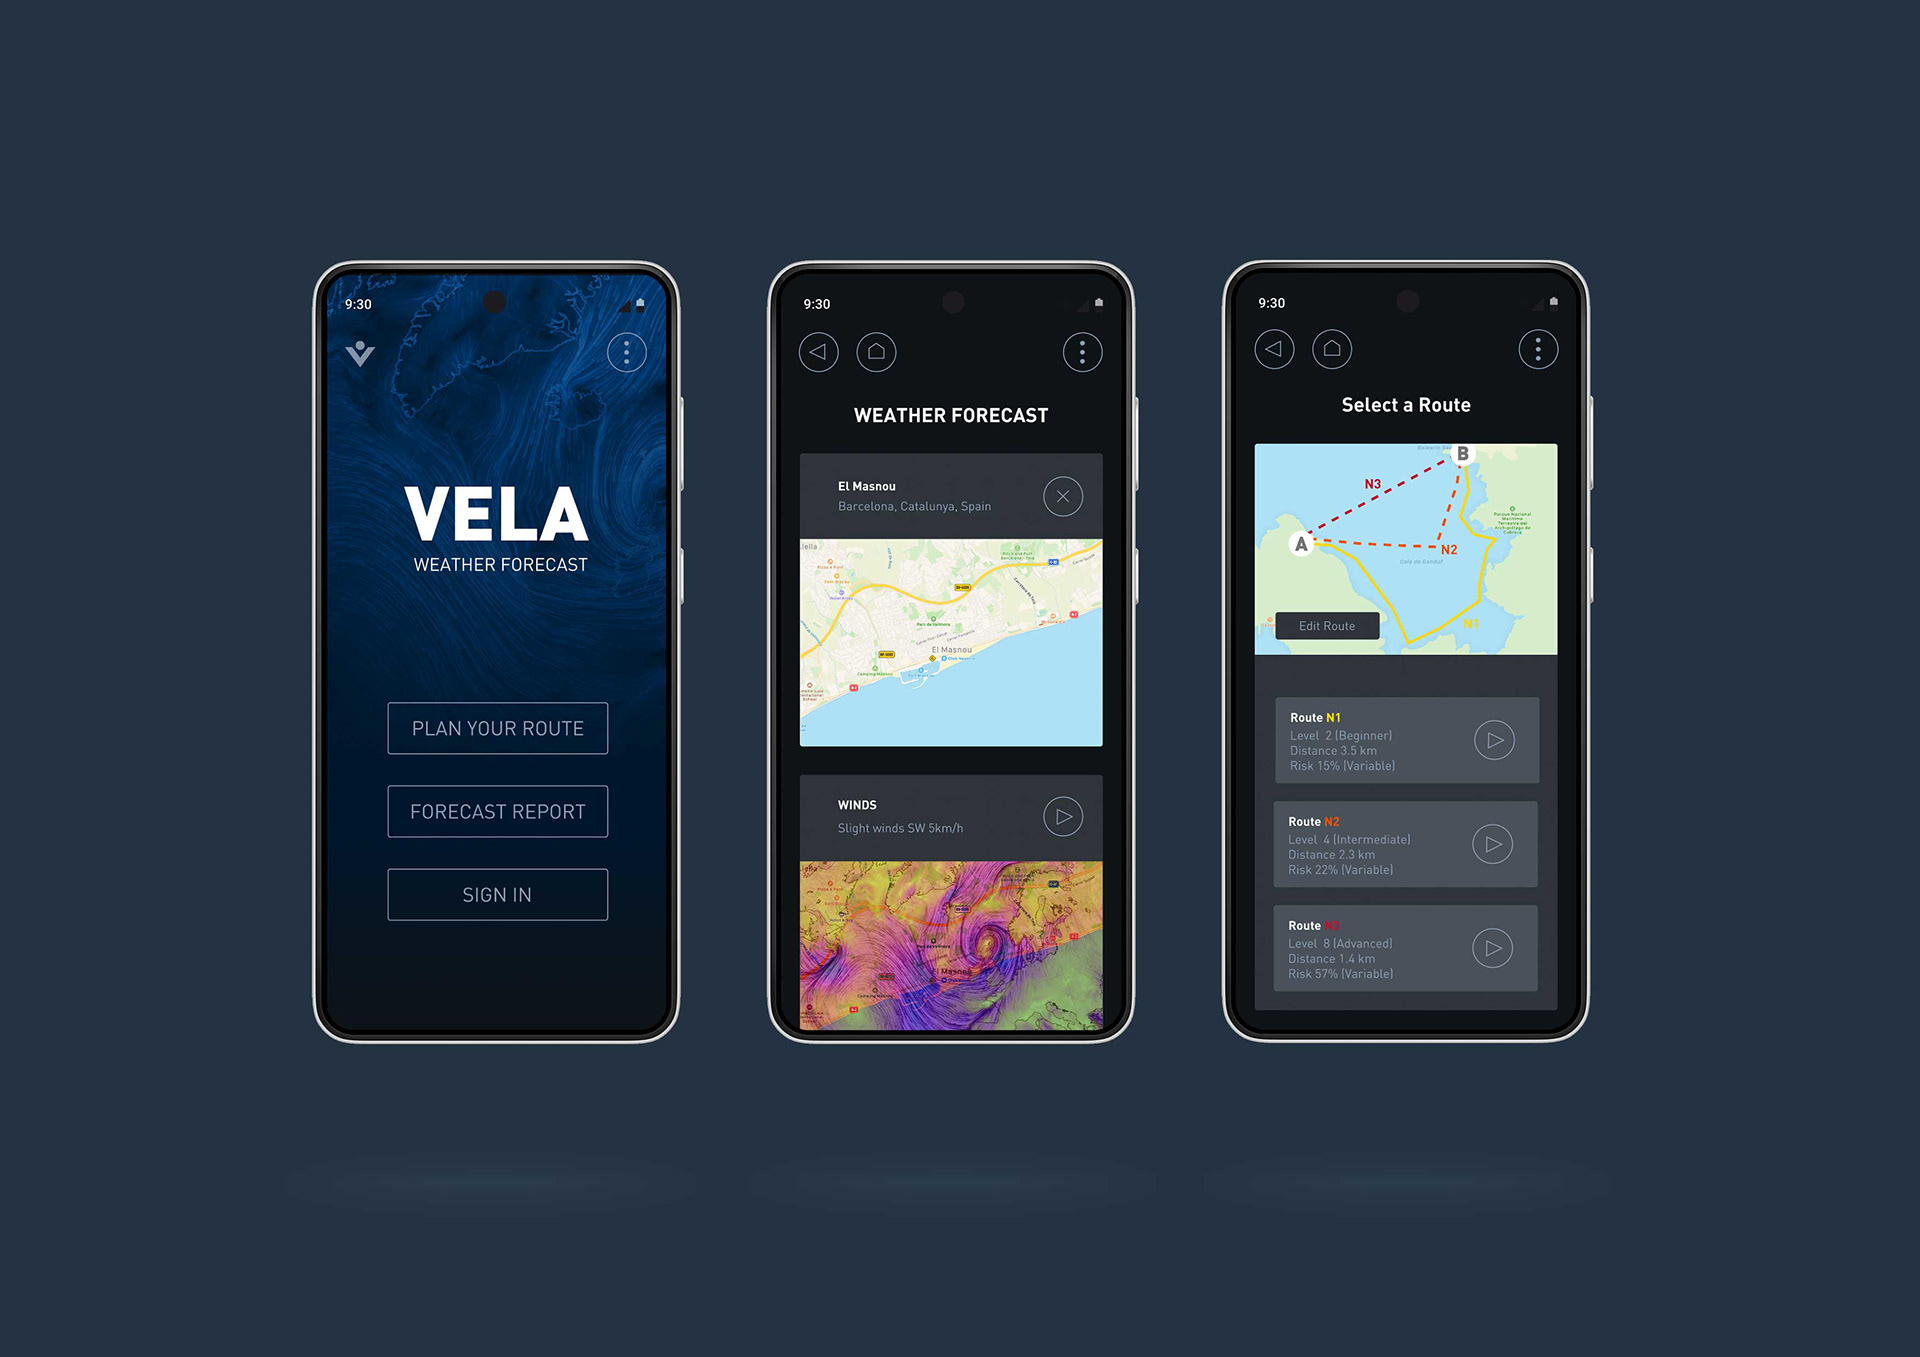
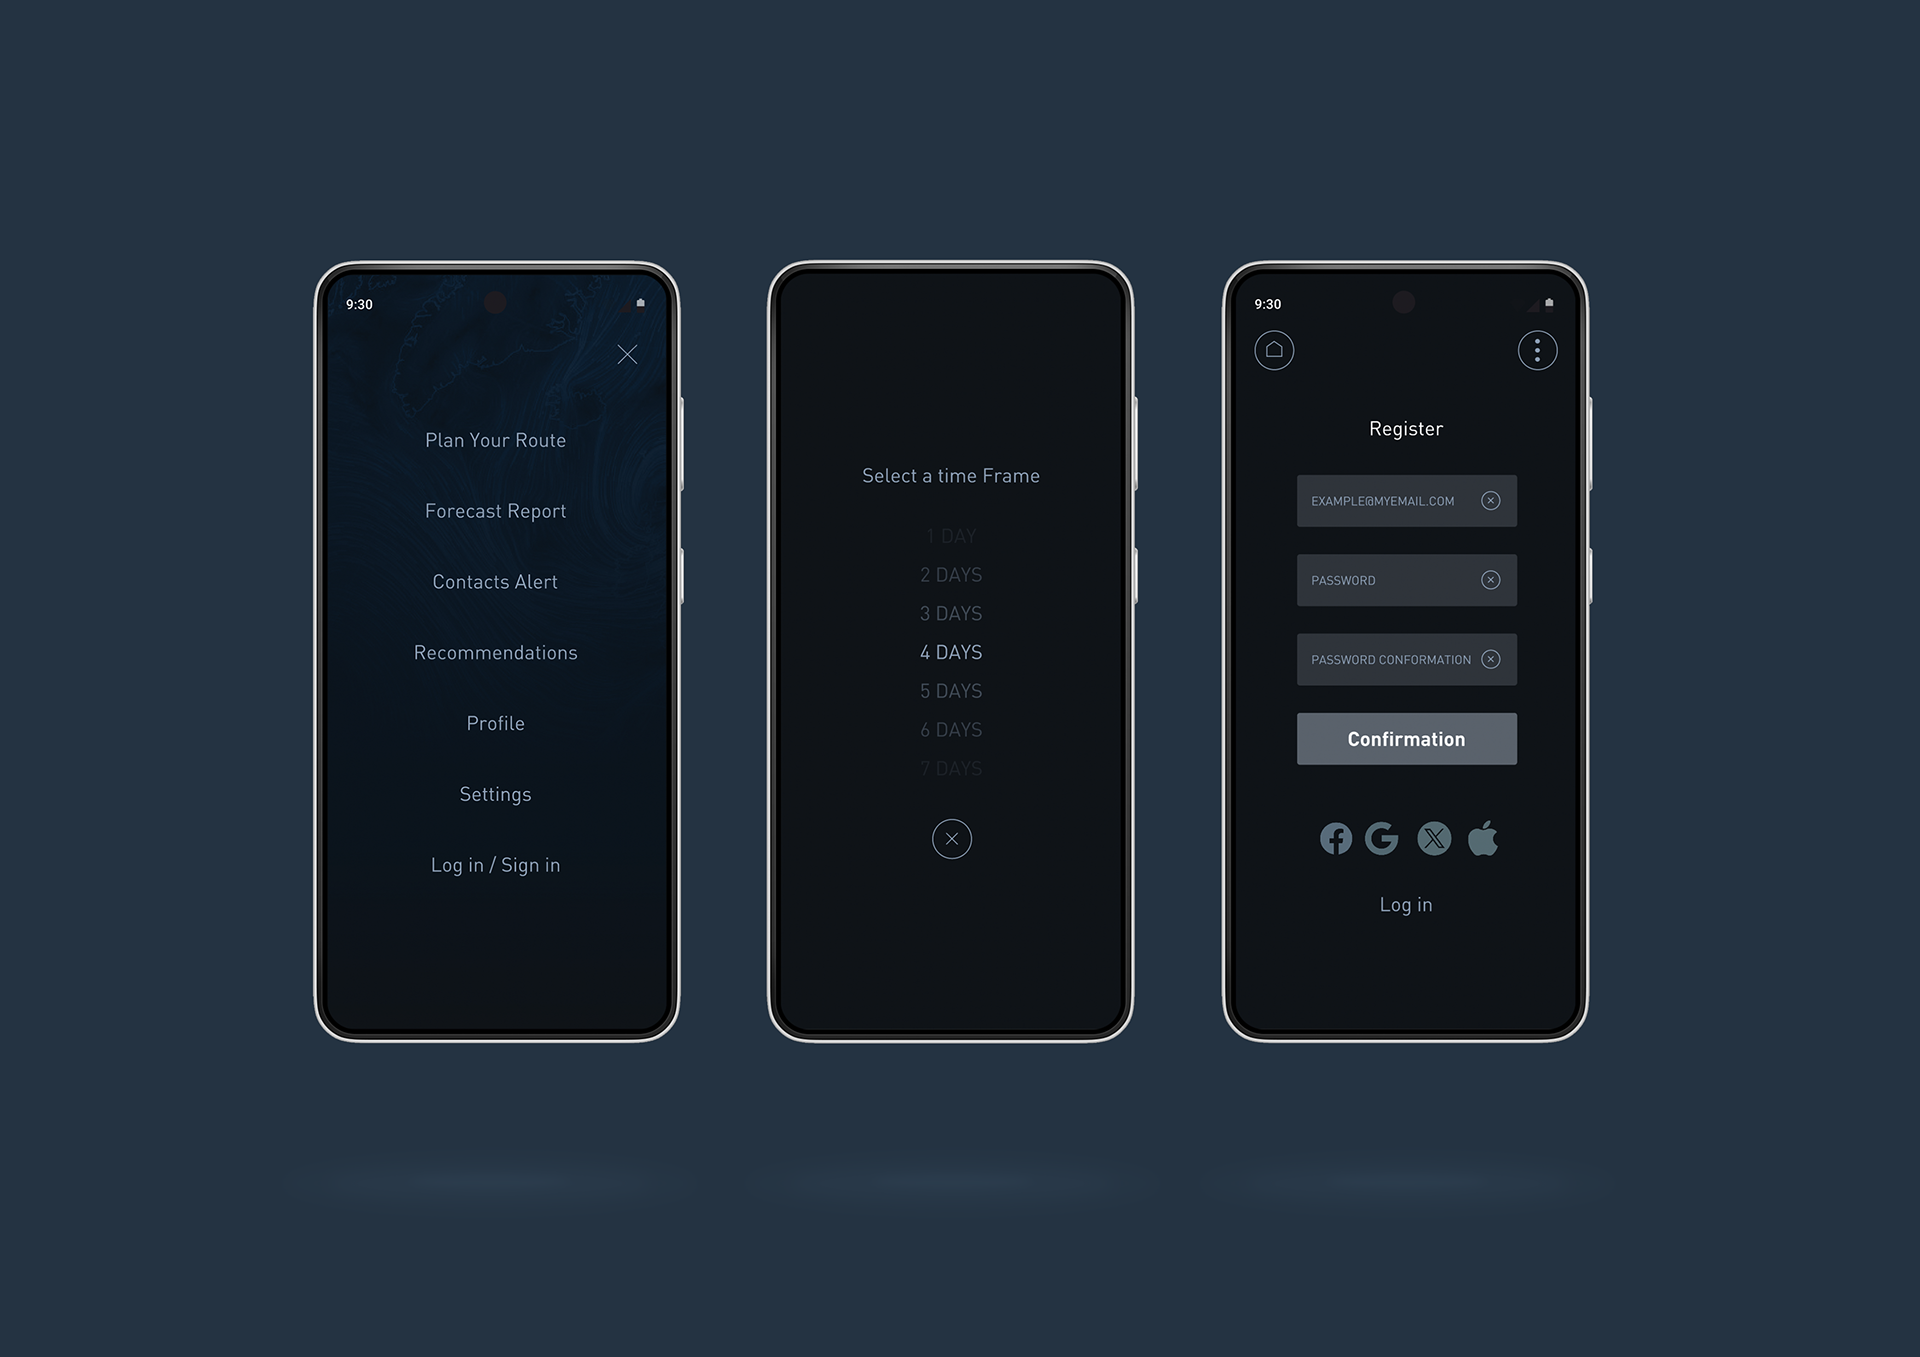
Main features
For the following images we will go through one of the main features "Route Planing" in order to see the iteration from Wireframe Prototyping to High Fidelity Prototyping.

Usability Testing
In this task I had the opportunity to have 6 participants, 3 in older ages Non-Native Digital users and 3 Native Digital Users.
The difference in between the two groups was impressive which made me realise, how I should re structure and improve elements of the design, such as the theme for example.
Goals:
- Measure learnability of the app
- Measure the efficiency in perfuming tasks
- Measure the errors
Methodology:
Remote Testing: The test was conducted through a video call with the instructions previously sent via email, together with the link of the clickable prototype.
Tasks:
1. On the first task the users had to go through the app for a quick overview and observe how they interacted with it.
With this task I have noticed something very particular in between the two groups of users (Native - Non Native Digital). The Non digital users were scrolling down-up as first interaction, for surprise 2/3 of the Native Digital users were going directly to the Menu navigation.
2. The users were provided with a scenario were they had to plan a route with the app feature Route Planning.
All of them were able to achieve the task successfully.
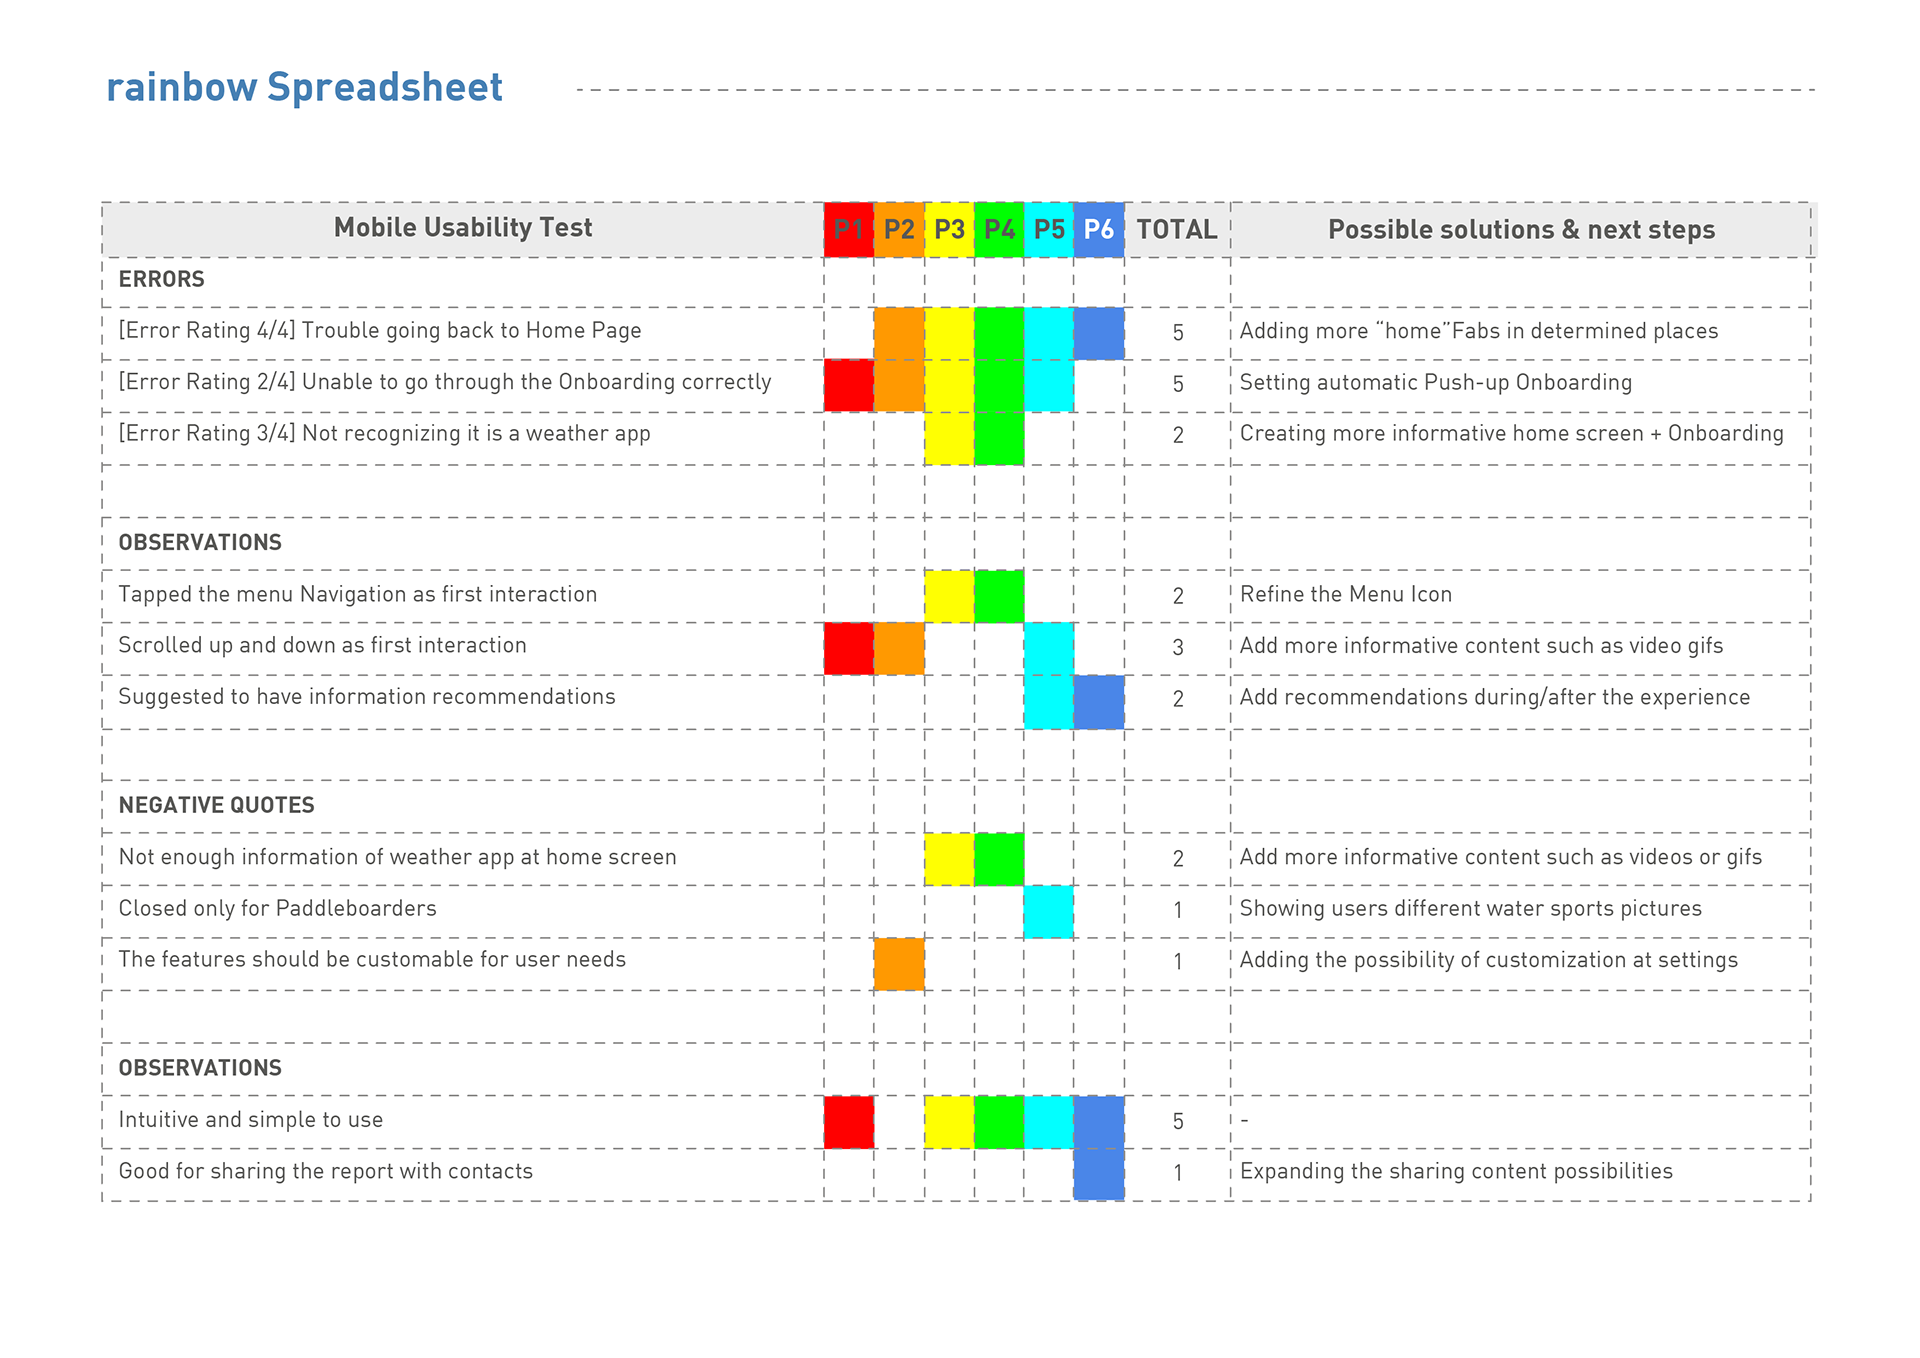
The Rainbow Spreadsheet was a very helpful tool to really associate all of the information gathered. But specially to see were the main focus should be put on in order to continuing with the iteration process.
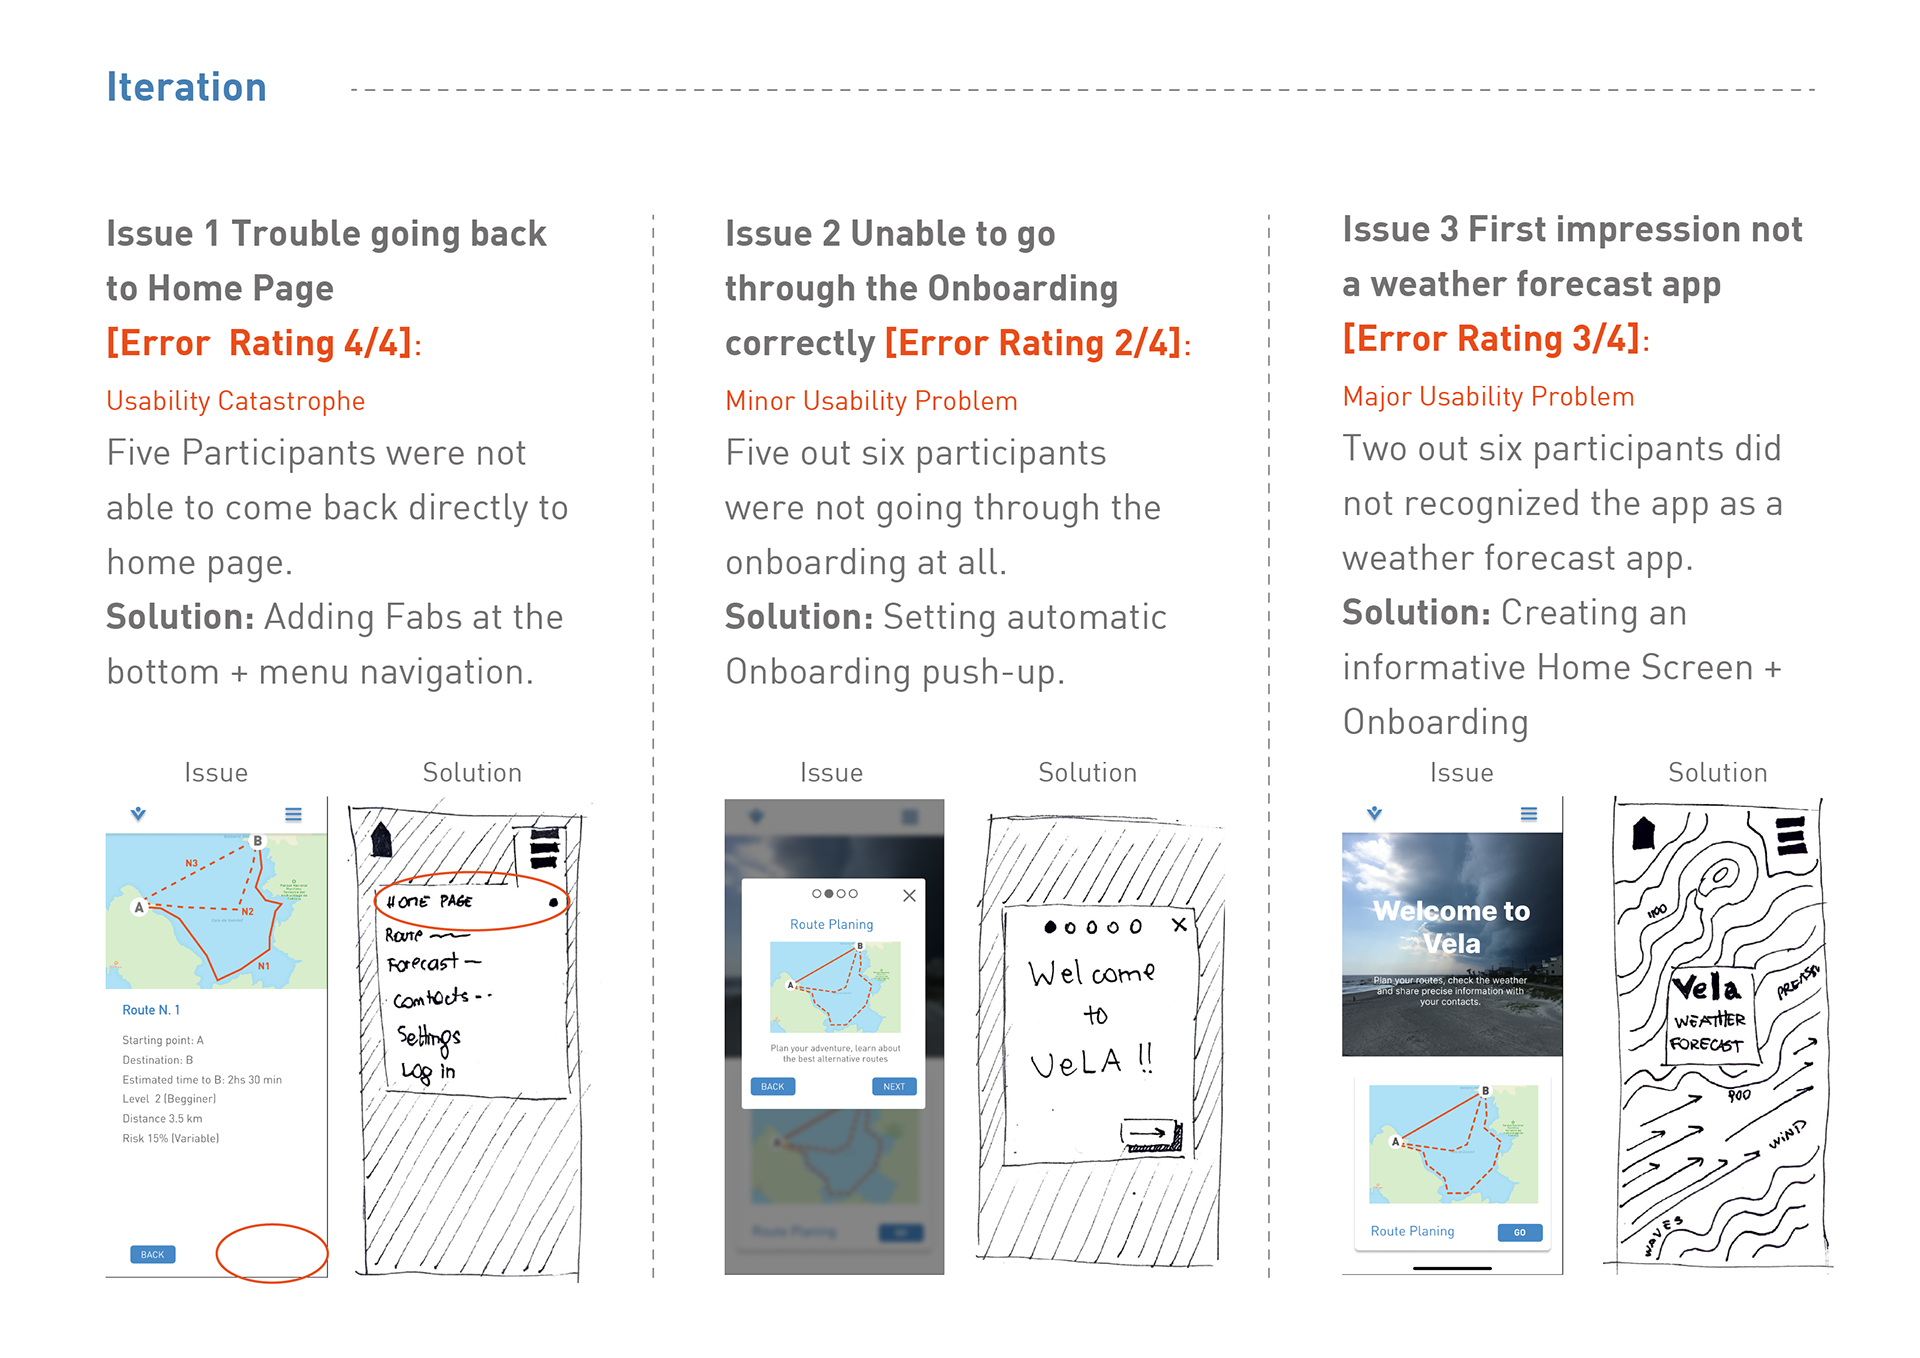
Final Product
We could better called this stage "Latest Version" of the product, as there is always place for improvements. Bellow we can see the result of the design iteration though testing and gathering debacle from UX Design colleagues which took the time to make helpful and constructive comments.
Here is a short Product Video Presentation that will help you understand more in detail how the App works, I hope you enjoy it!
Many Thanks!